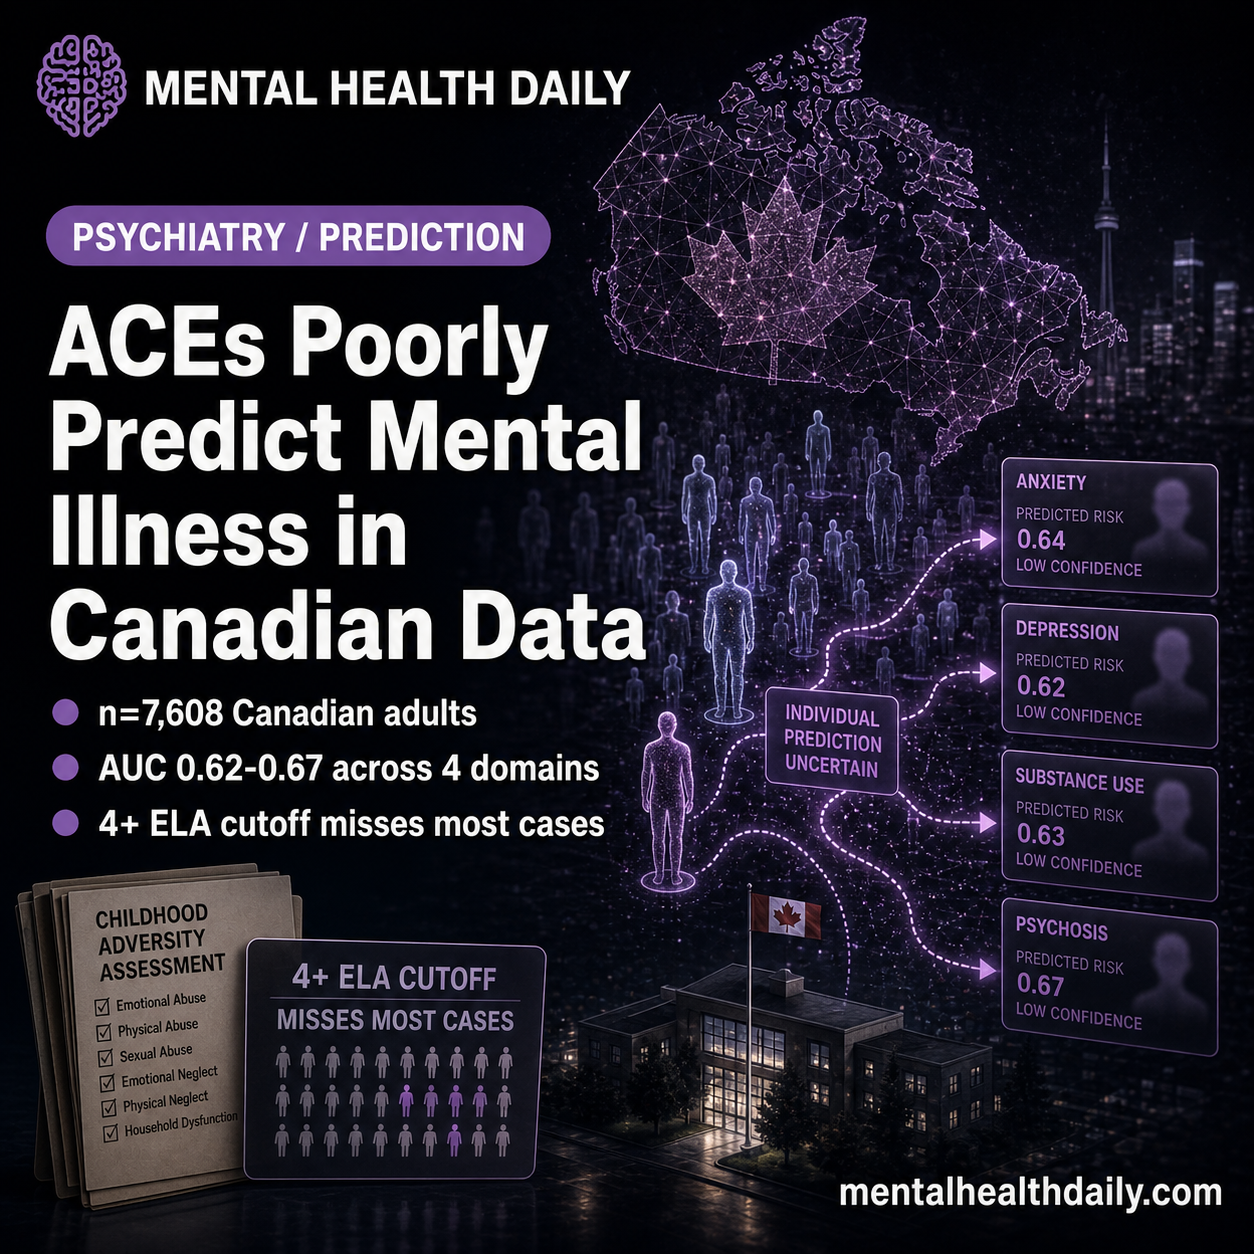
A 2026 nationally-representative study by Johnson, Parker, and Wade in the Canadian Journal of Psychiatry tested ACE-style screening in 7,608 Canadian adults and replicated what US, UK, and New Zealand cohorts already found: predictive accuracy is poor, with AUCs of 0.62 to 0.67 across anxiety, mood, substance use, and suicidality — all below the conventional 0.70 floor for “fair” clinical discrimination.1
Research Highlights
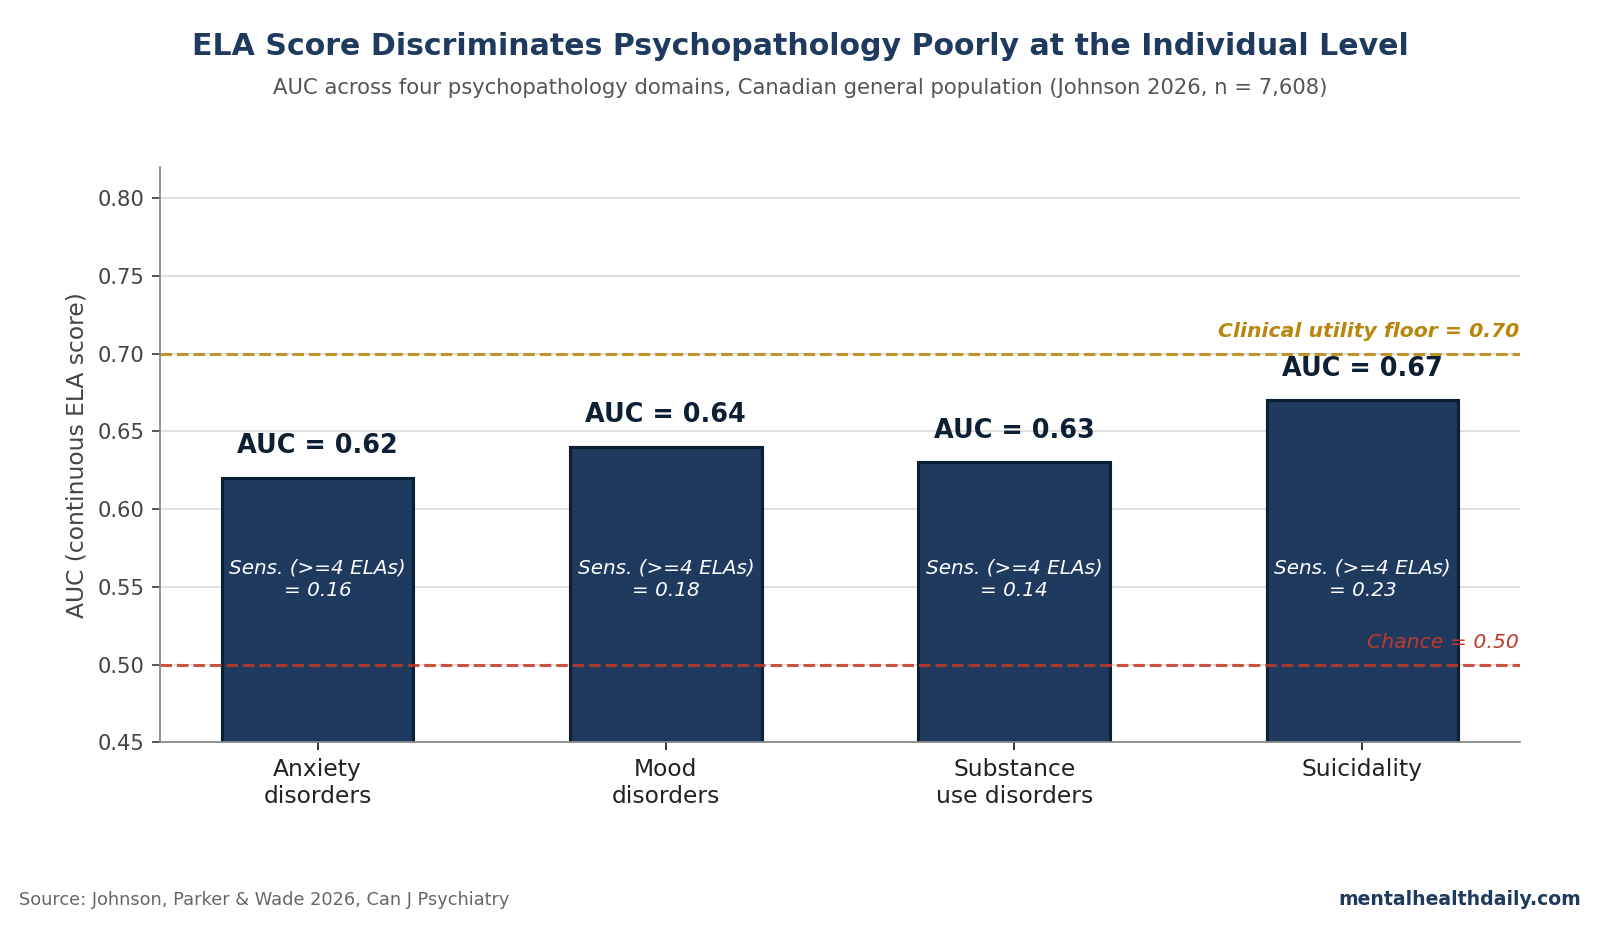
- Johnson 2026 analyzed 7,608 Canadian adults from the 2022 Mental Health and Access to Care Survey. Continuous ELA score discrimination was poor across all four psychopathology domains: AUC 0.62 (anxiety), 0.64 (mood), 0.63 (substance use), 0.67 (suicidality) — all below the 0.70 “fair” threshold.1
- At the commonly used ≥4 ELA cutoff, sensitivity was 0.14 to 0.23 — most future cases get missed. Specificity was high (0.93 to 0.94), so the cutoff is good at ruling out, not at ruling in.1
- Positive predictive values were 0.08 to 0.22. Even at the high-risk threshold, fewer than 1 in 4 people who screen positive will have the disorder being screened for.1
- The group-level dose-response held: vs. 0 ELAs, the odds ratio for ≥4 ELAs was 3.04 for anxiety, 3.48 for mood, 2.29 for substance use, and 4.27 for suicidality.1 Population association robust; individual prediction weak.
- The result is consistent with Baldwin 2021 (E-Risk and Dunedin cohorts) and Meehan 2022 (reanalysis of the original Felitti ACE data), neither of which found AUCs above the clinical-utility floor either.2,3
The popular framing of adverse childhood experiences (ACEs) blurs two distinct claims that don’t imply each other: that early-life adversity is associated with worse adult mental health at the population level (true and well-replicated), and that an ACE-style score can identify which individuals will develop a disorder (much shakier). The Johnson replication tests the second claim and finds it wanting.
The honest read isn’t that ACEs don’t matter. The group-level dose-response is real and replicates here: comparing ≥4 ELAs to none, odds of a 12-month disorder rise roughly fourfold for anxiety, mood, and substance use, and nearly eightfold for suicidality.1 Group-level signal this strong still doesn’t translate to individual prediction good enough to triage care. Both can be true at once.
Johnson 2026: 7,608 Canadians, Direct/Severe Adversity, Pandemic Window
The sample came from Statistics Canada’s Mental Health and Access to Care Survey, fielded between March and July 2022. After listwise deletion for missing ELA data, 7,608 respondents remained, with mean age 48 years and 51% female.
Past 12-month disorders were assessed via the World Mental Health-Composite International Diagnostic Interview, mapped to DSM-IV criteria for major depression, bipolar depression, generalized anxiety, social anxiety, any substance use disorder, and any suicidal ideation/plan/attempt.1
The adversity measure was the Childhood Experiences of Violence Questionnaire short form (CEVQ-SF) — 6 items focused on direct violence exposure (witnessing parental violence, being hit on the head, being shoved, being physically attacked, forced sexual activity, unwanted sexual touching). This is narrower and more severe than the Felitti 10-item ACE inventory, which bundled household-dysfunction items (parental divorce, mental illness, incarceration) with weaker mental-health associations.4
Data were also collected during the COVID-19 pandemic, when population mental health problems and putative ELA-related stress-sensitization were elevated.1 Both choices should have, if anything, improved predictive accuracy. Neither did.
AUC 0.62 to 0.67: Below the Clinical Utility Floor Across All Four Domains
The headline numbers are the AUCs, which summarize how well a continuous ELA score (0 to 6) separates people with and without each disorder across all possible cutoffs. Convention reads AUC values like this:
- 0.5 = chance, no discrimination
- 0.5 to 0.6 = very poor discrimination
- 0.6 to 0.7 = poor discrimination
- 0.7 to 0.8 = fair discrimination (the clinical-utility floor)
- 0.8 to 0.9 = good discrimination
- 0.9 to 1.0 = excellent discrimination
Johnson 2026’s AUCs land in the “poor” band across the board: 0.62 for anxiety, 0.64 for mood, 0.63 for substance use, 0.67 for suicidality.1 Translated: pick a random person with the disorder and a random person without it, and the diagnosed person has a higher ELA score about 62 to 67 times out of 100 — not far from the 50/50 you’d get from a coin flip.
The numbers nest inside a converging literature. Baldwin et al., working with the prospective E-Risk and Dunedin birth cohorts, reported AUCs of 0.55 to 0.66 for self-rated health, life satisfaction, smoking, depression, and anxiety — with no improvement when ACEs were measured prospectively.2
Meehan et al. reanalyzed Felitti’s original Kaiser ACE cohort and found AUCs of 0.57 to 0.65 across cardiovascular disease, diabetes, depression, and substance use.3 No replication has cleared the 0.70 floor.
High Specificity, Low Sensitivity: Good for Ruling Out, Bad for Ruling In
The AUC is the summary; the per-cutoff numbers are where the clinical implication lives. The most commonly used threshold in ACE-screening protocols is ≥4 events. At that cutoff, the Johnson data run as follows.1
- Sensitivity (true positive rate): 0.16 (anxiety), 0.18 (mood), 0.14 (substance use), 0.23 (suicidality). 77% to 86% of people with the disorder are missed by the cutoff.
- Specificity (true negative rate): 0.93 to 0.94 across domains. Most people without the disorder are correctly identified as not at high risk.
- Positive predictive value (PPV): 0.08 to 0.22. Of those flagged at ≥4 ELAs, between 8% (substance use) and 22% (anxiety) actually have the disorder.
- Negative predictive value (NPV): 0.92 to 0.97. Of those scoring <4 ELAs, the great majority don’t have the disorder.
That asymmetry is the clinically actionable point. A high-specificity, low-sensitivity test is useful for ruling out a condition in low-scorers and not much else.
A score of <4 ELAs gives reasonable confidence the person doesn’t have a 12-month disorder, but for the bulk of the population that’s already the base-rate prior — about half of the sample reported zero ELAs, and overall 12-month prevalence ran 3.6% to 9.8% across domains. The screen isn’t adding much.
Critically, the test fails the job it’s typically deployed for: identifying who needs intervention. At PPV = 0.08 for substance use disorder, the screen flags 12 people for every 1 who actually meets criteria. At PPV = 0.22 for anxiety, roughly 4 to 1. Where care capacity is constrained, those false-positive rates aren’t neutral.
Why Population-Level Links Don’t Translate to Individual Prediction
The dose-response in this study is robust. Compared to 0 ELAs, the odds ratios at ≥4 ELAs were 3.04 (95% CI 2.26–4.08) for anxiety, 3.48 (2.60–4.65) for mood, 2.29 (1.47–3.55) for substance use, and 4.27 (2.85–6.40) for suicidality.1
Those are real, statistically robust associations — consistent with the Hughes 2017 meta-analysis showing odds ratios in the 2- to 11-fold range for various health outcomes at ≥4 ACEs across 37 studies.5
So why doesn’t a fourfold odds ratio translate into useful individual prediction? Three reasons combine:
- Most cases come from low-risk groups, because low-risk groups are bigger. About 51% of the Canadian sample reported 0 ELAs and another 23% reported just 1; only 7% reported ≥4. Even with fourfold-elevated odds in the ≥4 group, the absolute number of depressed people in the 0–3 ELA group exceeds the number in the ≥4 group, because the 0–3 group is much larger. This is Geoffrey Rose’s 1985 paradox: population-attributable fraction concentrates in the middle of the risk distribution, not at the tail.6
- An ACE score is one rough variable, not a multivariate model. Counting yes/no across 6 items collapses heterogeneous experiences (one episode vs. chronic, age 4 vs. age 14, presence vs. absence of a buffering caregiver) into a single integer. The information loss is substantial. Models with timing, intensity, chronicity, and protective factors do better — but no current screening tool implements them.7
- Most psychopathology has multifactorial etiology that ELAs don’t capture. Genetic vulnerability, peer environment, head injury, substance exposure, recent life stressors, and adult sociodemographic factors all contribute. ELA explains a real but small slice of variance — enough to detect at the population level, not enough to forecast at the individual one.4
The same dissociation shows up across brief screeners in psychiatry: suicide-risk scales, PHQ-9 cutoffs in primary care, structured violence-risk instruments — all detect group differences but predict individual outcomes at AUCs that sit below the clinical-utility floor.1 Brief tools yield brief-tool accuracy.
Why Direct/Severe Adversity and Pandemic Stress Didn’t Lift the AUC
Two design features of Johnson 2026 should, in principle, have given ELA screening its best shot. Neither moved the result.
The CEVQ-SF asks only about direct violence exposure — physical abuse, sexual abuse, witnessing domestic violence — and excludes the household-dysfunction items the original ACE questionnaire bundles in. Direct/severe adversity has stronger associations with adult psychopathology than household dysfunction.4 Stripping out the weaker items should have concentrated signal. The AUCs still landed at 0.62 to 0.67.
Data were collected during the COVID-19 pandemic, when population-level depression and anxiety were elevated. Stress-sensitization theory predicts adults with ELA histories should react more strongly to collective stressors, raising the disorder rate among high-ELA individuals and improving discrimination at any cutoff.8 The pandemic context didn’t lift the AUCs either.
That double-null is informative. The ceiling on ELA-screening accuracy isn’t about which items you ask or when. It’s structural: a count of childhood adverse events doesn’t encode enough of the relevant variance to forecast adult psychopathology individually. Whether more sophisticated multivariate models that combine ELA with current symptoms, sociodemographics, and protective factors can clear the 0.70 floor remains an open empirical question.
Limitations of the Johnson Replication
Three caveats deserve weight before generalizing too far:
- Retrospective self-report. Adults asked about childhood experiences in their 40s underreport relative to prospective contemporaneous records, with concordance rates around 0.4 to 0.5 in studies that have both.9 Recall bias could push AUCs in either direction: recall might be enhanced among currently-symptomatic adults (state-dependent recall, which would inflate AUC), or attenuated by lifetime memory loss (which would deflate AUC). The Johnson AUCs sit close to those reported by Baldwin 2021 using prospective measures, suggesting recall isn’t the main limit.2
- Past 12-month outcomes only. The headline AUCs are for past-year disorders. A sensitivity analysis using lifetime outcomes produced the same pattern, so the result isn’t a window artifact — the screen also fails on the easier lifetime-presence task.1
- Acute-care settings may differ. Base rates in psychiatric clinics, addiction programs, and trauma services run well above the 4% to 10% population rates. PPVs scale with prevalence, so screening could perform somewhat better in those settings — though AUC, sensitivity, and specificity don’t change with prevalence and would still cap discrimination.10 The Johnson result speaks directly to universal/general-population screening, which is where most policy advocacy has been pushing.
It also bears noting that roughly 15% of respondents had missing outcome data and 4.7% were dropped for missing ELA data. If those who dropped out had both higher ELA exposure and worse mental health (plausible), the published AUCs may be conservative underestimates. Even with that conservative tilt, the screen still falls short.
ACE Screening Policy Needs More Than Low-AUC Prediction
California funds universal pediatric ACE screening through Medicaid; multiple Canadian provinces and US states recommend ACE screening as a treatment-planning tool; school-based screening proposals appear in policy documents from Massachusetts to British Columbia.1 The implicit theory of action: identify high-ACE individuals, route them to preventive services, reduce downstream psychopathology.
Johnson 2026, alongside Baldwin 2021, Meehan 2022, and McLennan 2019, suggests that theory of action doesn’t survive contact with the screening accuracy.2,3,11 At PPV = 0.08 to 0.22, the screen mostly flags people who don’t need referral while missing 77% to 86% of those who do.
Documented downsides — reactivation of trauma memory, parental fear of child-protective involvement, racial disparities in false-positive rates — make the cost-benefit math harder to defend.11,12
ACE research still changed how medicine thinks about the long shadow of childhood adversity. Felitti 1998 and the body of work it launched remain relevant for upstream prevention policy — reducing maltreatment, supporting families, addressing structural inequities.4
The calibration is narrower: the same evidence base that justifies population-level intervention doesn’t justify using a brief ACE count as a clinical triage tool for individuals.
Reader Questions on the Johnson Replication and ACE Screening
Do ACEs cause mental illness?
At the population level, more ACEs reliably track higher odds of depression, anxiety, substance use, and suicidality, with dose-response gradients robust across dozens of studies; Johnson 2026 shows 3- to 8-fold odds ratios at ≥4 ELAs vs. 0.1 Causation is plausible but confounded by genetic vulnerability, family environment, and adult socioeconomics. The association is real; pure causal attribution in any one case overstates what observational data show.5
Why is the AUC so low if the odds ratios are so high?
Odds ratios summarize average group differences; AUC summarizes how cleanly a score separates individuals. A 4-fold odds ratio sounds large, but if base rates are 5% to 10%, most diagnosed people will still come from the lower-ACE majority — that group is bigger. Population-level association and individual-level prediction can both be true at once.6
Should clinicians stop asking about childhood adversity?
No. Clinical interviews about childhood history are useful in psychotherapy and trauma-informed care. Johnson 2026 critiques a narrower use case: using a count of ACEs as a brief screening tool to triage services. Detailed history-taking and individualized assessment are different from a checkbox screener.11
Is the ≥4 cutoff arbitrary?
Largely, yes. The ≥4 threshold traces to the original Felitti work, where 4 cumulative ACEs marked an inflection in adult disease risk in a Kaiser HMO population. It propagated into screening tools without strong validation as a clinical threshold. Johnson 2026 also tested ≥1, ≥2, and ≥3 cutoffs — same pattern across all of them.1
Does the original Felitti study still hold up?
The dose-response associations Felitti reported in 1998 across 17,000 Kaiser HMO adults have replicated extensively at the population level. What hasn’t held up is using the ACE score for individual prediction. Anda, a co-author on the original work, has co-authored commentary noting that the score was designed as an epidemiological measure of population risk, not a clinical screener for individuals.7
Could a better screening tool fix this?
Possibly. Models combining timing, chronicity, type-specific weighting, current symptoms, and protective factors might clear the 0.70 AUC floor — but no validated multivariate ELA-based model has done so yet in independent samples. The field’s next move is multivariate risk modeling, not better count-based screeners.1,7
References
- Predicting mental health risk from early-life adversity: a population-based study of Canadian adults. Johnson D, Parker V, Wade M. The Canadian Journal of Psychiatry. 2026. doi:10.1177/07067437261442418
- Population vs individual prediction of poor health from results of adverse childhood experiences screening. Baldwin JR, Caspi A, Meehan AJ, et al. JAMA Pediatrics. 2021;175(4):385–393. doi:10.1001/jamapediatrics.2020.5602
- Poor individual risk classification from adverse childhood experiences screening. Meehan AJ, Baldwin JR, Lewis SJ, MacLeod J, Danese A. American Journal of Preventive Medicine. 2022;62(3):427–432. doi:10.1016/j.amepre.2021.08.008
- Childhood adversity subtypes and young adulthood mental health problems: unpacking effects of maltreatment, family dysfunction, and peer victimization. Sayyah MD, Merrick JS, Larson MD, Narayan AJ. Children and Youth Services Review. 2022;137:106455. doi:10.1016/j.childyouth.2022.106455
- The effect of multiple adverse childhood experiences on health: a systematic review and meta-analysis. Hughes K, Bellis MA, Hardcastle KA, et al. The Lancet Public Health. 2017;2(8):e356–e366. doi:10.1016/s2468-2667(17)30118-4
- Sick individuals and sick populations. Rose G. International Journal of Epidemiology. 1985;14(1):32–38. doi:10.1093/ije/14.1.32
- Inside the adverse childhood experience score: strengths, limitations, and misapplications. Anda RF, Porter LE, Brown DW. American Journal of Preventive Medicine. 2020;59(2):293–295. doi:10.1016/j.amepre.2020.01.009
- Coping with COVID-19: testing the stress sensitization hypothesis among adults with and without a history of adverse childhood experiences. Russo JE, Dhruve DM, Oliveros AD. Journal of Affective Disorders Reports. 2022;10:100379. doi:10.1016/j.jadr.2022.100379
- Prospective and retrospective measures of child maltreatment and their association with psychopathology: a systematic review and meta-analysis. Baldwin JR, Coleman O, Francis ER, Danese A. JAMA Psychiatry. 2024;81(8):769–781. doi:10.1001/jamapsychiatry.2024.0818
- The association of sensitivity and specificity with disease prevalence: analysis of 6909 studies of diagnostic test accuracy. Murad MH, Lin L, Chu H, et al. CMAJ. 2023;195(27):E925–E931. doi:10.1503/cmaj.221802
- Routine ACEs screening is NOT recommended. McLennan JD, MacMillan HL, Afifi TO, McTavish J, Gonzalez A, Waddell C. Paediatrics & Child Health. 2019;24(4):272–273. doi:10.1093/pch/pxz042
- Is ACEs screening for adolescent mental health accurate and fair? Cohen JR, Choi JW. Prevention Science. 2022;23(7):1216–1229. doi:10.1007/s11121-022-01391-3
Leave a Reply