
⏱ 9 min read
Main
Major depressive disorder (MDD) is a highly heterogeneous disorder, encompassing a diverse range of symptoms and frequent overlap with other psychiatric and neurological disorders. This clinical heterogeneity may also contribute to the differences in suicide risk1 and is probably one reason why the efficacy of current treatments is often difficult to predict at the individual level2. There is therefore an urgent need to better understand the neural and biological mechanisms underlying different symptom profiles of MDD and to identify biomarkers that could support more personalized treatment approaches3.
During the past decade, neuroimaging research has increasingly recognized MDD as a disorder of large-scale brain networks, particularly through abnormalities in functional connectivity (FC)4,5,6. Studies using resting-state functional magnetic resonance imaging (fMRI) have consistently linked MDD to changes in the organization and dynamics of FC in the limbic and frontostriatal networks7,8,9, the default mode network (DMN)10,11,12, or to the crosstalk between the networks4,13 whereby hyperconnectivity is linked to mood regulation, sustained negative affect and rumination. By contrast, hypoconnectivity of the frontoparietal control network is associated with deficits in cognitive control14. Evidence showed that time-varying dynamic coupling appears to mediate distinct clinical symptoms15.
Multivariate approaches that map brain–symptom associations16,17,18, combined with clustering methods that group participants on the basis of their co-occurring brain activity patterns, have proven to be clinically informative ways to capture heterogeneity in mental disorders. Using these approaches, previous fMRI studies have revealed clinically relevant biological depression phenotypes associated with distinct symptom profiles and different responses to pharmacological and brain stimulation interventions8,19,20,21. More recently, normative models22 and personalized brain scores23 have identified depression phenotypes with different sensitivity to pharmacological interventions. These findings have contributed to a growing view of depression treatment as a form of network modulation targeting specific dysfunctional circuits. However, a recent meta-analysis did not find consistent generalization of individual-level biomarkers for MDD24, highlighting the need for new methodological approaches.
Although magnetoencephalography (MEG) is less widely available than MRI, it provides a unique window into fast neural dynamics that are highly relevant to depression pathophysiology. Whereas the fMRI signal reflects slow neural fluctuations in blood oxygenation signal (BOLD) on multisecond time scales (<1 Hz), MEG directly captures neural population activity with millisecond precision25. This makes it possible to study rapid neural processes that cannot be resolved using fMRI alone. Combined with source reconstruction, MEG also yields precise anatomical accuracy. Neural activity is organized into rhythmic oscillations across different frequency bands in subsecond temporal scales (>1 Hz) recorded by electrophysiological approaches. These arise from the interactions between excitatory pyramidal neurons and GABAergic inhibitory interneurons. Oscillations are fundamental for neural computations and provide millisecond-resolution temporal clocking mechanisms by creating temporally correlated windows of excitability26. Transiently coupled large-scale oscillatory networks have been found to be essential for dynamic routing of information in healthy brain functions27,28,29, and, conversely, aberrant oscillatory dynamics are characteristic to neuropsychiatric disorders30. Therefore, oscillations can translate cellular-level mechanisms to behavior and cognition.
Crucially, one key cellular-level pathophysiological factor in MDD is disrupted GABAergic inhibitory functioning and excitation/inhibition (E/I) imbalance associated with deficient somatostatin (SST)-interneuron-driven inhibition31,32. Consistent with these models, previous electroencephalography (EEG) studies have reported abnormalities in several frequency bands (see reviews in refs. 33,34), including interhemispheric asymmetry in the alpha band35 and altered theta activity in anterior cingulate cortex36. Altered oscillatory activity also reflects treatment-induced neuroplasticity following pharmacological and nonpharmacological interventions34,37. Source-reconstructed MEG data, with superior spatial accuracy over EEG, have further confirmed oscillatory alterations in depression, including abnormal gamma oscillations in the visual cortex38 and irregular beta bursts in the orbitofrontal cortex39. Recent EEG studies demonstrated the biomarker potential of local alpha and theta oscillations40, alpha peak frequency41,42 and their relevance for intervention outcome prediction43,44.
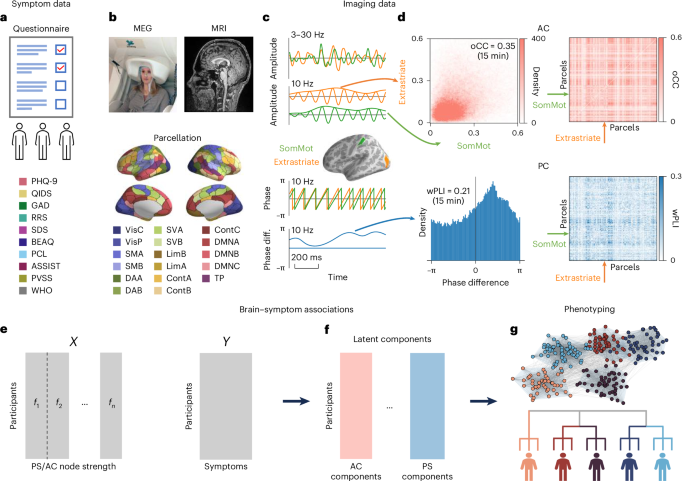
Despite these advances, evidence for altered electrophysiological FC in depression remains limited. A recent study found greater beta-2 band (18.5–21 Hz) connectivity within DMN and greater beta-1 band (12.5–18 Hz) connectivity between the DMN and the frontoparietal network45, while another reported decreased alpha-band connectivity46. Yet, although MEG and EEG methods are well suited to capture oscillation-based network dynamics that may directly reflect underlying neural mechanisms and inhibitory dysfunction, no previous studies have used oscillatory FC patterns to identify biologically distinct depression phenotypes by clustering patients according to shared connectivity profiles. To address this knowledge gap, we collected symptom data using 10 self-report questionnaires (Fig. 1a) as well as resting-state MEG and MRI (Fig. 1b) data from 263 patients with MDD and from 75 healthy controls (HCs) and computed individual brain oscillatory connectomes (Fig. 1c,d). We then computed multivariate brain–symptom associations (Fig. 1e) and leveraged the latent components (Fig. 1f) to identify depression phenotypes with clustering algorithms (Fig. 1g).
a, Symptom data were collected with ten self-report symptom scales: PHQ-9, QIDS, GAD, RRS, SDS, BEAQ, PCL, ASSIST, PVSS and WHO. b, MEG data were source-reconstructed using individual structural MRI and parcellated into the Schaefer atlas with 200 parcels encompassing 17 networks. c, Broadband MEG time series (top row) for each parcel were filtered with a Morlet wavelet to obtain narrowband amplitudes (second row), phase (third row) and phase difference (last row) time series. d, Pairwise AC was computed with oCC, and pairwise PS was assessed with wPLI from phase differences. e, Brain–symptom associations were assessed with PLSC, a multivariate approach, applied separately for AC and PS. f, Significant latent components were computed from AC and PS separately and then concatenated for clustering analysis. g, Leiden clustering was performed to derive data-driven depression phenotypes. Note that c and d show empirical results, and g shows hypothesized results. VisC, visual central network; VisP, visual peripheral network, SMA, somatomotor network A; SMB, somatomotor network B; DAA, dorsal attention network A; DAB, dorsal attention network B; SVA, salience/ventral attention network A; SVB, salience/ventral attention network B; LimA, limbic network A; LimB, limbic network B; ContA, control network A; ContB, control network B; ContC, control network C; DMNA, default mode network A; DMNB, default mode network B; DMNC, default mode network C; TP, temporoparietal network.
Results
Symptom heterogeneity
The clinical cohort comprised 263 patients (age range 18–60 years, mean age 34.3 years) diagnosed with MDD (Table 1). The presence of a depressive episode was verified with the Mini International Neuropsychiatric Interview (MINI) 6.0.0 module and patients were required to have an existing contact to the Finnish healthcare system. The MDD cohort comprised N = 163 or 62% (cis) female participants, N = 87 or 33% (cis) male participants and N = 13 or 5% ‘other’ (Supplementary Fig. 1a). No significant differences in age were found between any pair of sex categories (two-tailed Mann–Whitney U test, P = 0.061, r = 0.118 for male–female, P = 0.536, r = 0.047 for female–other, and P = 0.155, r = 0.143 for male–other comparisons). The HC cohort (age range 18–60 years, mean age 31.9 years) comprised N = 75 participants with 39% (N = 29) (cis) female participants, 60% (N = 45) (cis) male participants, and 1% (N = 1) ‘other’ (Supplementary Fig. 1b). No significant differences in age were found between male and female cohorts (two-tailed Mann–Whitney U test, P = 0.458, r = 0.087). The MDD and HC groups differed significantly in sex distribution (chi-square test, χ2 = 14.94, P = 0.0001 for male–female comparison) and age (two-tailed Mann–Whitney U test, P = 0.005, r = 0.153).
We used the Patient Health Questionnaire (PHQ-9) as the primary measure of depression severity. The PHQ-9 scores for the clinical cohort (N = 263) ranged from 5 to 27, with a mean of 14.82 and a standard deviation (s.d.) of 4.66. The clinical cohort comprised 15%, 31%, 36% and 18% of patients with mild, moderate, moderately severe and severe depression (thresholds: 5, 10, 15 and 20), respectively (Fig. 2a). In addition to PHQ-9, to map the heterogeneity of depression, self-reported symptom scales were collected with nine other questionnaires: Quick Inventory of Depressive Symptomatology 16-item (self-report) (QIDS), Generalized Anxiety Disorder 7-item (GAD), The Ruminative Responses Scale Short-version (RRS), Sheehan Disability Scale (SDS), Brief Experiential Avoidance Questionnaire (BEAQ), PTSD Checklist for DSM-5 (PCL), Alcohol, Smoking, and Substance Involvement Screening Test Lite (ASSIST), Positive Valence Systems Scale (PVSS), and WHO-5 Well-Being Index (WHO) (see details in the Methods). All ten questionnaire scores were normalized to a 0–1 scale based on the minimum and maximum values of their native score range, and WHO and PVSS scores were inverted for better comparability with the other scores, so that a higher normalized score consistently indicated more severe symptoms (Fig. 2). All symptom scores had high heterogeneity across the depression cohort, the scores being the smallest for ASSIST measuring substance abuse, and the largest for the inverted WHO-5 scale indicating overall poor well-being in the cohort (Fig. 2a). Female participants in the MDD cohort had significantly higher scores for depressive severity (QIDS), anxiety (GAD), rumination (RRS) and post-traumatic stress disorder (PTSD; PCL), and lower scores for anhedonia (PVSS) and substance abuse (ASSIST) than male participants (1,000 bootstrapping at the alpha level of 0.05; Supplementary Fig. 2).
a,b, Symptom score distributions for the MDD cohort (a) and the HC cohort (b). The MDD cohort comprised 263 participants, whereas the HC group included 75 participants. Top: Distribution of PHQ-9 scores, which assess the overall severity of depression. Total scores of 5, 10, 15 and 20 represent cutting points for mild, moderate, moderately severe and severe depression, respectively. Bottom: distribution of all ten symptom scores, using both boxplots and probability density functions (PDFs), including PHQ-9, QIDS, GAD, RRS, SDS, BEAQ, PCL, ASSIST, PVSS and WHO. All scores were normalized to a 0–1 scale based on the minimum (left side numbers) and maximum (right side numbers) values of the native score range for each individual questionnaire. Please note that WHO and PVSS scores were inverted (subtracted from 1 after min–max normalization) to maintain the direction of symptom severity, ensuring that a higher normalized score consistently indicates more severe symptoms. Box plots show the median (center line), the interquartile range (box limits, 25th–75th percentiles) and whiskers extending to the most extreme data points within 1.5× the interquartile range (IQR). Outliers are shown as individual points.
In the MDD cohort, 32.7% of patients had only been diagnosed with depression, while the rest had one or more comorbid diagnoses, most commonly with anxiety (21.3%) or attention deficit hyperactivity disorder (6.8%) (Supplementary Fig. 1c). In the HC cohort, the mean symptom scores were significantly smaller compared with the MDD cohort and mostly below the clinical threshold of 5 (Fig. 2b). While five HC participants had slightly higher scores on PHQ-9, they were undiagnosed and did not fulfill the criteria of depression (MINI module-A) before filling in self-report questionnaires, and they were therefore assigned to the HC group.
Oscillation-based FC
The 15-min resting-state MEG data were source-reconstructed using individual MRI-derived head models, collapsed into 200 cortical parcels of the Schaefer atlas, and Morlet-filtered at 32 center frequencies from 2 to 60 Hz. No significant differences were found in power between MDD and HC groups both at the whole-brain and parcel levels (Fig. 3a,d, two-tailed Mann–Whitney U test, P < 0.05). Oscillation amplitudes averaged across parcels peaked in the alpha band at 10 Hz as demonstrated before47,48 and showed no significant differences between MDD and HC groups (Supplementary Fig. 3a,b, two-tailed Mann–Whitney U test, P < 0.05, false discovery rate (FDR) corrected).
a–c, The spectrum of power (a), AC GS (b) and PS GS (c) from the MDD cohort (N = 263) and the HC cohort (N = 75). Power values are shown with a y-axis scaling factor of 1 × 10⁻¹⁴ in a. No significant differences were found in AC and PS GS and power between MDD and HC cohorts (two-tailed Mann–Whitney U test, P < 0.05, FDR corrected). The confidence intervals (CIs) in a–c were obtained by the 2.5th and 97.5th percentiles on the mean values for each frequency from 1,000 bootstrapping. d–f, Fraction of parcels where MDD and HC cohorts differed significantly (Mann–Whitney U test, alpha-level subtraction, 0.25 for each tail) for power (d), AC (e) and PS (f). The gray area in d–f indicates the Q level that defines the chance level (2.5% for each side) for false positives raised in any of the 32 frequencies. Sign., significance; n.s., not significant.
Oscillation-based FC was estimated at each frequency between all parcel pairs for two coupling modes, interareal phase synchrony (PS) and amplitude correlations (AC), which reflect partially dissociated and complementary mechanisms of neural interactions28,49,50,51. PS captures the precise temporal coordination of neural oscillations between regions on a millisecond timescale, reflecting how consistently oscillations align in phase. By contrast, AC measures slower cofluctuations in oscillation strength over time, reflecting coordinated changes in the overall level of neural activity. Together, these two coupling modes capture partially distinct but complementary aspects of large-scale neural interactions. Interareal PS was estimated with the weighted phase lag index (wPLI) and AC with the orthogonalized correlation coefficient (oCC), both of which are insensitive to direct effects of source leakage52. The oscillatory networks were represented as graphs with parcels as nodes and connections between parcels as edges53. At the whole-brain level, we estimated graph strength (GS) (the average of strength across all edges), which peaked in the alpha (8–13 Hz) band for both coupling modes as previously reported for resting-state data51,54. The peak was wider for AC (5–30 Hz) than for PS (6–15 Hz) (Fig. 3b,c). No statistically significant differences were found between the HC and MDD cohorts in GS for either coupling mode (Fig. 3b,c and Supplementary Figs. 3c,d and 4a,b, two-tailed Mann–Whitney U test, P > 0.05, FDR corrected). To map PS and AC connectivity at the parcel level, we computed node strength (NS) for each parcel, which reflects the mean strength of connections for each node. The MDD cohort exhibited weaker AC NS in the delta band (2–4 Hz) compared with the HC cohort. By contrast, PS NS was weaker in the theta (4‒5 Hz) and alpha-low-beta (10–15 Hz) bands in MDD than HC participants but stronger in the delta (2–4 Hz) band (Fig. 3e,f and Supplementary Figs. 4c,d and 5) underscoring only minor differences at the group level as found before in neuroimaging55. To understand whether AC and PS convey similar information, we computed their correlations on GS. In both HC and MDD groups, PS and AC GS was correlated in the theta–alpha and beta bands, as previously observed in healthy participants51, and additionally in the gamma band in the MDD group (Supplementary Fig. 6). Although significant, these correlations were only moderate, indicating that the coupling modes yield complementary information.
Brain–symptom associations of oscillation-based connectivity
To reveal latent brain–symptom associations, we applied a multivariate approach using partial least squares correlation (PLSC). PLSC reduces dimensionality by jointly decomposing two high-dimensional datasets into pairs of latent components that provide a low-dimensional representation of each dataset and are optimally correlated, thereby capturing shared multivariate structure between the datasets. Therefore, PLSC yields clinically meaningful dimensionality reduction for linking the two oscillatory coupling modes to diverse depression symptoms. Age and sex effects were first regressed out. We then calculated the cross-covariance of symptoms and NS for AC and PS separately. Sex explained 1.2% variance for PS and 0.7% for AC. To estimate the statistical significance of latent components, the singular values of the cross-covariance from the observed data were compared against 1,000 permuted values. One significant latent component was derived from AC (P = 0.0085) and another from PS (P = 0.0452) (Fig. 4a). Correlations between the significant brain latent component and the symptom latent component were significant for both AC (Fig. 4b, top, r = 0.1798, P = 0.0034) and PS (Fig. 4b, bottom, r = 0.2046, P = 0.0008).
a, Singular values from the SVD of the cross-covariance matrix between oCC NS and symptom scores (top), and between wPLI NS and symptom scores (bottom). LC, latent component. b, The Pearson correlation between the symptom latent component and the NS latent component (top: AC, bottom: PS). The shaded region represents the 99% bootstrap confidence interval (10,000 bootstrap samples). c, The contribution of symptoms to the two significant latent components (one from PS, P = 0.0452 and one from AC, P = 0.0085). d, Fraction of parcels per frequency among the top 10% of features contributing the most to the two latent components. e, Spatial patterns of oCC at two peak frequencies (5 and 27 Hz) in d. f, Spatial patterns of wPLI at two peak frequencies (13 and 24 Hz) in d.
The AC-derived latent component was associated with symptom dimensions including rumination (RRS), anhedonia (PVSS), PTSD (PCL), substance abuse (ASSIST) and well-being (WHO) (Fig. 4c). Symptom contributions to this latent component were distributed across both positive and negative loadings, underscoring differential and complementary symptom relevance with AC. By contrast, the PS-derived latent component captured the overall severity of depressive symptoms as measured with PHQ-9 and QIDS, along with the other eight symptom scales (Fig. 4c). The contributions of symptoms to the latent components were generalizable and stable, except for QIDS and SDS in the AC-derived components, whose contributions were minimal (Supplementary Fig. 7a).
To reveal the spectral contributions to the latent components, we plotted the fraction of parcels per frequency among the top 10% NS values that contributed the most to the latent components. For the AC-derived latent component, the key contributions were found in theta (4–8 Hz) and beta (25–28 Hz) bands (Fig. 4d). These spectral profiles were robust against the cutoff percentage (Supplementary Fig. 7c–h). For the AC-derived latent component, the theta-band contributions were primarily localized to posterior regions and were dominated by the DMN network, the dorsal attention network (DAN), the control network and the visual network, while the beta-band contributions were primarily influenced by DMN, DAN and the control network (Fig. 4e and Supplementary Fig. 8a). By contrast, for the PS-derived latent component, the key contributions were found in the alpha band (11–16 Hz) and the beta bands (22–26 Hz). The alpha-band component was contributed by anterior regions and associated with DAN, DMN, the control network and the limbic network, while the beta-band component was contributed by posterior regions and extensively linked to DMN and the visual network (Fig. 4d,f and Supplementary Fig. 8b). These findings suggest that each latent component represents features from distinct frequency bands, reflecting neural underpinnings of brain–symptom associations in a frequency- and symptom-specific manner. The contributions of NS to the latent components were generally stable, except for the theta band in the PS-derived components, but their contributions were minimal (Supplementary Fig. 7b,h).
To confirm that brain–symptom associations were not due to sex or age effects, we performed the PLSC separately for male and female participants. The GS did not differ significantly between female and male cohorts neither for AC nor PS (two-tailed Mann–Whitney U test, P > 0.05) (Supplementary Fig. 9a). Nevertheless, the latent brain–symptom associations exhibited distinct patterns for the female and male cohorts (Supplementary Fig. 9b,c). In the female cohort, beta-band (20–30 Hz) PS showed a significant correlation with depression severity (PHQ-9 and QIDS) and anxiety (GAD) (P = 0.0027), whereas in the male cohort, depression severity (PHQ-9 and QIDS), well-being (WHO) and anhedonia (PVSS) were significantly associated with theta–alpha band (4–9 Hz) and beta band (24–30 Hz) AC (P = 0.027). The results thus suggest different brain–symptom association mechanisms for AC and PS coupling modes in male and female participants. We also performed PLSC on the whole cohort without having sex as a confound (Supplementary Fig. 9d). Significant latent components were found between AC and symptoms (P = 0.024), as well as between PS and symptoms (P = 0.018). The beta-band AC contributed more compared with when including sex as a confound, and the contribution of symptoms also changed, indicating that sex has some influence on brain–symptom associations.
To assess age effects, we computed brain–symptom associations while regressing only sex effects out. We obtained one significant latent component from AC (P = 0.0145), while there were no significant latent components from PS (with the smallest P value being 0.0525) (Supplementary Fig. 10). Contributions of symptoms and AC NS to the latent components were, however, very similar to the results when both sex and age were regressed out, indicating that age did not substantially influence the results on AC.
For the HC cohort, we did not find any significant latent components with PLSC for AC (smallest P value: 0.104) nor for PS (smallest P value: 0.22), speaking against any significant brain–symptom associations.
Phenotype identification
Oscillation-based FC exhibits large variability even among healthy participants54. To identify phenotypes that are specific to MDD rather than to the overall variability in FC, we used the two significant latent components of brain–symptom associations to identify depression phenotypes with the Leiden clustering method56. To determine the optimal resolution for clustering, we calculated modularity across a wide range of resolution values (Fig. 5a). We obtained higher modularity values across the resolution range of 0.6–1.1, within which patients transitioned from being grouped into fewer and larger clusters to more numerous and smaller clusters (Fig. 5b). This pattern reflects the emergence of increasingly fine-grained community structure as resolution increases. Using the elbow method to determine the optimal resolution (0.85), we obtained six distinct clusters with high modularity. As one cluster contained only two patients, probably representing outliers, we excluded this cluster from further analyses and used the five remaining clusters (Fig. 5c). Including the second latent components from both AC and PS showed the robustness of clusters 2 and 3 but split the other clusters further (Supplementary Fig. 11).
a, Modularity of observed data and surrogate data as a function of resolution in the Leiden clustering method. b, Changes in clustering results for MDD patients as a function of resolution. c, The similarity matrix between patients sorted by clusters. d, Scatterplot of the AC- and PS-derived latent components. e, Spectrum of GS of AC (left) and PS (right) for five phenotypes and the HC group. Asterisks indicate significant differences against the HC group (P < 0.05, two-tailed Mann–Whitney U test, FDR-corrected with the Benjamini–Hochberg method). Confidence intervals (95%) were obtained via 1,000 bootstrap resampling of the across-participant mean. f,g, The s.d. of NS across clusters for AC (f) and PS (g) in the alpha (8–12 Hz) and beta (16–24 Hz) bands. Averaged NS for each cluster was min–max normalized to the range 0–1, and then their s.d. values were calculated across clusters for each parcel. h, Phenotype variability of PS connectivity strength between parcels in the alpha (8–12 Hz) band. Averaged connectivity strength for each cluster was min–max normalized to the range of 0–1, and then their s.d. values were calculated across clusters. Vis, visual network; TP, temporoparietal network; SM, somatomotor network; SV, salience/ventral attention network; Lim, limbic network; DA, dorsal attention network; DMN, default mode network; Cont, control network. i, Symptom profiles (z-scored) for the five phenotypes. The dashed circle at a value of 0 represents the mean of z-scored symptom scales across the whole clinical cohort. The colored and thick color bars in each cluster represent statistically significant differences compared to the other clusters (bootstrapping, N = 10,000, at P < 0.05). Error bars represent the 2.5th–97.5th percentiles, and the center of error bars indicates the mean value of symptom scores for each cluster.
We then validated the phenotypes using several approaches. First, we confirmed that the identified clusters were well separated by the two dimensions of brain–symptom AC and PS latent components that were used for clustering. Latent component values differed significantly between the clusters (two-tailed Mann–Whitney U test, FDR corrected, P < 0.05; Fig. 5d and Supplementary Fig. 12a). To confirm that the obtained results were not due to sampling bias, we conducted a replication analysis based on 1,000 iterations of the phenotyping pipeline using independent random subsamples that accounted for 80% of the full cohort. This demonstrated a robust reproducibility of the identified depression phenotypes (Supplementary Fig. 12b,c), confirming that the phenotypes are stable and not dependent on the selected sample. Finally, we performed a cross-validation analysis to test whether we could classify individuals to correct clusters by training a decision tree classifier to predict cluster membership for each individual. We established that the mean classification accuracy for correctly assigning individuals to each cluster was above 96% for each cluster (Supplementary Fig. 12d) indicating the phenotype assignment for individuals was highly accurate.
Phenotype characterization
Having established the robustness of the phenotypes, we subsequently examined whether PS and AC for each cluster differed significantly from the HC group. At both whole-brain (Fig. 5e) and parcel levels (Supplementary Figs. 13 and 14), all five depression phenotypes demonstrated distinct spectral profiles differing from the HC group for both PS and AC in a frequency- and anatomy-specific manner.
Cluster 1 exhibited moderate alpha–beta-band hyperconnectivity in AC and PS, with a wider frequency band for AC (7–20 Hz) than PS (7–9 Hz and 18–22 Hz). Similarly, cluster 5 exhibited overall robust hyperconnectivity both in AC (2–60 Hz) and PS (6–30 Hz). Meanwhile, clusters 2–3 exhibited widespread hypoconnectivity in a frequency-specific manner. Cluster 2 exhibited hypoconnectivity in the theta–alpha band (5–10 Hz) AC and alpha–beta band (8–30 Hz) PS, and cluster 3 over a wide frequency range in AC (2–60 Hz) and in PS (6–30 Hz). Cluster 4 exhibited hypoconnectivity in AC within the delta–theta range (2–8 Hz) but hyperconnectivity in PS in the beta–gamma band (25–40 Hz). Interestingly, GS in the alpha band peaked at different frequencies across clusters for AC, specifically at 9, 11, 11, 10 and 8 Hz for clusters 1–5, respectively, whereas for PS, all clusters showed a 10 Hz peak except for cluster 3 at 11 Hz. (Fig. 5e).
Overall, spatial variability across clusters was the largest for alpha-band AC in temporal regions and lateral prefrontal cortex, while beta-band AC varied the most in frontal areas (Fig. 5f). PS in the alpha band showed higher variability across clusters in the parietal and temporal regions, including areas in DAN and DMN, and PS in the beta band varied more across visual and somatomotor areas (Fig. 5g). When comparing connectivity for each phenotype separately, cluster 1 exhibited increases in AC posterior regions for both alpha and beta but also in somatomotor and medial prefrontal cortex for beta-band PS, while for cluster 5, hyperconnectivity was more widespread across parietal and frontal regions, and for beta-band AC, also across temporal regions. In clusters 2 and 3, the strongest decreases were generally observed in similar regions as increases for clusters 1 and 5 (Supplementary Fig. 14). At the edge level, AC in alpha and beta bands reflected phenotypic variability in connectivity strength both within and between hemispheres (Supplementary Fig. 15a,b), while PS in alpha and beta bands exhibited phenotypic variability within each hemisphere (Fig. 5h and Supplementary Fig. 15c,d). These findings highlight that depression phenotypes differed in spatial FC patterns in different frequencies.
No significant differences between clusters were found for sex (Supplementary Fig. 16a, chi-square test at P > 0.05, FDR corrected) and age (Supplementary Fig. 16b, two-tailed Mann–Whitney U test at P > 0.05, FDR corrected) distributions. We then tested whether symptom profiles of one phenotype differed significantly (bootstrapping, N = 1,000, P < 0.05) from the rest of the cohort (Fig. 5i). All symptom scores were z-scored across the whole cohort, so that the zero circle represented the average scores across patients after normalization. WHO and PVSS scores were inverted (multiplied with –1) before z-scoring to maintain the direction of meaning, ensuring that a higher normalized score consistently indicated more severe symptoms. The values outside the zero circle indicated more severe symptoms, while values below 0 indicated less severe symptoms.
Cluster 1, the moderate-hyperconnectivity phenotype, showed higher symptom burden across several domains, including QIDS (depressive), GAD (anxiety), RRS (rumination), SDS (functional impairment), PCL (PTSD) and PVSS (positive valence and anhedonia). Cluster 5, the strongest-hyperconnectivity phenotype, showed higher substance use involvement and lower PTSD symptom scores. By contrast, hypoconnectivity cluster 2 exhibited generally lower symptom burden compared with the other depression phenotypes except for RRS and BEAQ. Cluster 3, with robust hypoconnectivity, was associated with lower RRS and ASSIST symptoms but with larger PCL and BEAQ scores, thus reflecting a distinct PTSD-enriched phenotype. Cluster 4, with AC hypoconnectivity and PS hyperconnectivity, was characterized by higher PHQ-9, ASSIST and WHO scores. Overall, these results established that the identified MEG oscillation phenotypes were characterized by different symptom profiles, representing different dimensions of depression symptoms.
We further assessed whether comorbid diagnosis, medication status and recording sites could have confounded the clustering results. Comorbid diagnoses were relatively evenly distributed across clusters (Supplementary Fig. 17a), indicating that they did not bias phenotype identification. Consistently, each comorbid diagnosis explained only a very small proportion of the variance in AC and PS NS, suggesting a limited influence on oscillation-based connectivity measures and the resulting phenotyping (Supplementary Fig. 17c). In addition, latent components derived from the subgroup of patients with MDD who have comorbid anxiety only (N = 142) were highly correlated with those derived from the full cohort (r = 0.99 for AC and r = 0.96 for PS), further supporting the conclusion that comorbidity had only subtle effects on phenotypes. Medication status was likewise fairly evenly distributed across clusters and accounted for very little variance in AC and PS NS (Supplementary Fig. 17b,d). MEG data were acquired at two sites, but when the site was modeled as a potential confound, it explained only 0.39% of the variance in AC and 0.35% in PS. This indicates that site-related effects had a negligible influence on MEG connectivity and are unlikely to account for the main findings. Taken together, these results indicate that phenotype assignment was driven by genuine associations between oscillation-based FC and symptom profiles, and the identified clusters are more likely to reflect mechanistically meaningful phenotypes of MDD than artifacts of comorbid diagnosis, medication status or site differences.
Discussion
MDD is a heterogeneous disorder both in its clinical symptoms and in the underlying neural mechanisms. Increasing evidence suggests that biological, genetic, neuroimaging and behavioral measurements can help to identify clinically meaningful depression phenotypes differing in symptom expression and possibly sensitivity to specific interventions and can help to guide personalized medicine applications in psychiatry57. The most evidence comes from fMRI-based FC studies, showing that patients with depression can be clustered into distinct phenotypes based on similarity in connectivity patterns8,21. However, fMRI only indirectly measures neural activity through changes in blood oxygenation. By contrast, electrophysiological methods, such as MEG, are direct measures of neural activity and may therefore provide a more biologically grounded view of depression-related brain dysfunction pathophysiology in depression. Yet, depression phenotypes have not been identified for electrophysiological connectivity data. Here, we demonstrate that individually source-reconstructed MEG data and oscillation-based connectomes can identify biological depression phenotypes with differing neural and clinical characteristics.
Neural oscillations are one of the key mechanisms linking cellular and molecular deficiencies to the whole-brain dynamics and behavior58. In line, oscillatory aberrancies characterizing depression are modulated by antidepressant treatments59. Our results of altered large-scale oscillation-based FC are consistent with findings of both excitatory and inhibitory deficiencies, such as deficiencies in the GABAergic SST interneurons in cellular models of depression32,60. Together, these results suggest that cellular inhibitory dysfunction may contribute to abnormal brain network dynamics that ultimately manifest as depressive symptoms.
The two connectivity measures used in this study—PS and AC—capture complementary aspects of brain communications occurring at different temporal scales. PS and AC reflect distinct coupling modes of fast millisecond precision temporally coincident spike correlations and slower fluctuations in amplitude envelopes28,51, respectively. Accordingly, their associations with symptoms differed. Specifically, brain–symptom correlations for alpha band PS were found in anterior brain regions of the DMN, limbic and DAN networks, all of which have been previously linked with depression61,62. By contrast, for beta-band PS as well as theta- and beta-band AC, these contributions were mostly found in the posterior brain regions across various functional networks45,63. These findings suggest that brain–symptom associations unfold on region-specific temporal scales of brain network dynamics, characterized by faster coupling dynamics in anterior regions and slower coupling dynamics in posterior regions and thus yield complementary information. The brain–symptom associations highlighted the contribution of beta-band AC only in male participants, showing sex differences. The sex differences might be related to the prevalence of MDD and have a multifactorial etiology64,65.
In this study, we found five depression phenotypes. Two phenotypes exhibited frequency-specific hyperconnectivity compared with HCs, while two phenotypes expressed hypoconnectivity in both AC and PS, and one phenotype closely resembled the HC pattern. Interestingly, hyperconnectivity phenotypes peaked at low-alpha band (8–9 Hz) range, the hypoconnectivity peaked at high-band (11–12 Hz) range, suggesting different circuit mechanisms across phenotypes and consistent with different roles of low and high alpha-band oscillations66. The presence of both excessive and deficient oscillation-based connectivity indicates that distinct pathophysiological mechanisms contribute to depression symptoms across the affected population, and this might help explain why previous studies have reported conflicting findings of both increased45,67 and decreased alpha connectivity46, as well as the recent negative findings of a meta-analysis on fMRI data55.
An important question is whether these biological phenotypes are clinically meaningful. Our results show that the five MEG connectivity phenotypes exhibited statistically different symptom profiles. Cluster 1 phenotype, exhibiting moderate hyperconnectivity especially in beta-band and alpha-band AC, represented the broad high-symptom phenotype with more severe symptoms across most domains. Consistent with previous findings linking hyperconnectivity, especially in DMN, with excessive self-referential processing and rumination63,68,69, we found differences in medial prefrontal cortex, which is also expanded in individuals with depression7. Increased connectivity was also found in somatomotor, possibly reflecting psychomotor symptoms and sensorimotor slowing down70, arising from hyperconnectivity in the thalamo-cortical network that includes somatomotor areas71. Cluster 5 phenotype, showing the strongest hyperconnectivity across the whole frequency spectrum, had a substance-use-enriched symptom profile, differing only in having more severe substance abuse and weaker PTSD symptoms, thus showing the specificity of connectivity patterns on symptoms. By contrast, hypoconnectivity phenotypes (clusters 2 and 3) showed less severe symptoms. Interestingly, cluster 3 with hypoconnectivity was specific to PTSD symptoms highlighting that PTSD has distinct underlying neurophysiology mechanisms compared with other symptoms, which aligns with the recent identification of distinct molecular pathologies and markers for PTSD and MDD using brain multiomic molecular dysregulations72. The spatially and spectrally distributed oscillation connectivity patterns across phenotypes support the idea that depression is primarily associated with the disruption of brain dynamics and changes in network interactions15.
Crucially, we found that oscillatory connectivity phenotypes were associated with variations of individual alpha peak frequency (iAF), a neurophysiological marker linked to cognitive functioning and mental health. Higher iAF has been associated with enhanced cognitive performance, whereas lower iAF has been linked to increased symptom severity across multiple psychiatric conditions41,73. Consistent with these findings, cluster 1, characterized by a lower iAF, was associated with more severe depressive symptoms, while cluster 2 with higher iAF was associated with less severe symptoms. These findings support the potential utility of iAF as a biomarker for stratifying depression phenotypes41.
We also observed sex differences in brain–symptom relationships, suggesting that partially distinct oscillatory mechanisms may contribute to depressive symptoms in male and female participants. This is consistent with previous evidence that depression differs between sexes in symptom presentation, hormonal influences, neuroplasticity and network-level brain organization74,75,76,77. Interestingly, depressive symptoms in female participants were more strongly associated with PS, which is a mechanism for precise temporal coordination. Future work will need to explore the possible sex-specific causes of differences in oscillatory synchronization with adequately powered data.
Together, our findings demonstrate that MEG-based oscillatory FC can define biologically meaningful depression phenotypes with distinct neural and clinical profiles. Given that oscillations are among the key mediators between cellular neurophysiology and behavior, these phenotypes probably reflect underlying cellular and molecular deficiencies in depression. These phenotypes were stable under repeated within-cohort subsampling and therefore putatively generalizable to a wider population. As MEG is unlikely to serve as a first-line diagnostic tool for all patients with MDD, its near-term clinical value may be in specialist settings where conventional clinical assessment is insufficient and where a circuit-level physiological readout could inform treatment stratification or neuromodulation targeting. Rather than ready-to-use diagnostic biomarkers, the present phenotypes thus contribute to candidate mechanistic stratification markers paving the way toward personalized psychiatry applications. Further work with independent datasets will be necessary to validate and refine these phenotypes and to assess their clinical utility.
Methods
Recruitment
These data were collected as a substudy of the clinical trial ‘Meliora RCT’, a remote, randomized, double-blinded, comparator-controlled, cross-over, add-on and three-arm clinical device trial with 18–65-year-old adults with an interview-confirmed MDD diagnosis. The study was approved by the Helsinki University Hospital Regional Committee on Medical Research Ethics (HUS/3042/2021) and the Finnish Medicines Agency (FIMEA/2022/002976) and conducted in compliance with the Declaration of Helsinki. The main study was preregistered on ClinicalTrials.gov (NCT05426265). All patients gave their informed written consent before participation.
The study patients were recruited in collaboration with Finnish healthcare partners (Helsinki University Hospital, Turku University Hospital and Mehiläinen Ltd.), with whom research permits were signed, and clinicians were encouraged to share information about the study with their patients. Participants were also recruited through social media (Facebook, Instagram and Reddit), email campaigns and posters placed at university campuses. All recruitment channels guided the interested patients to the study website, where they digitally signed an informed consent form.
Participants
The study patients were adults aged 18–65 years with interview-confirmed MDD. Patient eligibility was evaluated in a phone interview conducted by Clinical Subject Coordinators (CSC). The CSCs evaluated MDD using the MINI 6.0.0. module A78, which is based on the Diagnostic and Statistical Manual of Mental Disorders 4th edition criteria (DSM-IV). Patients were required to have an existing mental health treatment contact. Patients with suicidality were excluded from the study. When necessary, the CSCs evaluated suicidality using the MINI module B, where a score of 17 or more was considered an absolute exclusion criterion. Patients with severe self-report gaming addiction were also excluded. When necessary, the CSCs evaluated patient gambling addiction with the Problem Gambling Severity Index, where a score of 8 or more served as exclusion criteria, and digital gaming addiction with a shortened 7-item version of the Gaming Addiction Scale (GAS-7), where four or more answers of ‘sometimes’, ‘often’ or ‘very often’ constituted exclusion criteria. Patients who were unable to consent, pregnant or nursing, inmates or forensic patients, had a psychotic disorder or had a neurological disorder such as epilepsy or brain injury (migraine did not prevent participation) were excluded.
Study participants consisted of the volunteers from the main study with N = 263 patients with MDD (163 female, 87 male and 13 labeled as ‘other’) and 75 HC participants (29 female, 45 male and 1 labeled as ‘other’). Criteria for study inclusion for both groups included age in the range 18–65, normal or corrected to normal vision, and compatibility with neuroimaging methods. Here, ‘female’ and ‘male’ refer to participants’ biological sex as recorded in the study data. All participants were Finnish speaking. Information of ethnicity was not collected due to ethical restrictions of the study. Ethnicity is assumed to be white based on the information of self-reported nationalities. Participant compensation was paid according to the decree of the Finnish Ministry of the Social Affairs and Health 82/2011 §2.
Clinical diagnosis
To assess the acuteness and severity of MDD symptoms, a brief structured diagnostic interview, the MINI module78, was conducted during the phone interview. Requirement for study inclusion for the MDD patients was a score of 5 or more and a ‘yes’ answer to question A4 (‘Have the symptoms caused you substantial problems at home, school, in social, professional or other important areas of activity?’). For HC participants, the requirement for study inclusion was a score of less than 5 in the assessment. Interviewers were experienced health care professionals or students trained in the use of the MINI interview. If the interviewee expressed suicidal ideation, the interviewer asked for clarifying questions and if, according to the estimation of the interviewer, there was concern for risk of self-harm, the interviewee could not be included in the study and was encouraged to reach out for their health care provider. If the interviewer was uncertain of the severity of suicidality, the MINI module B (Suicidality) could be conducted, in which a score of 17 or more was a definite indication for exclusion. In addition, the interviewer could, at their discretion, exclude the interviewee with a lower score.
Symptom measures
All participants were required to complete ten self-report symptom scales to assess various aspects of mental health and functioning. These scales include PHQ-9 measuring depressive symptoms (range 0–27), QIDS evaluating depressive symptom severity (range 0–27), GAD scale assessing anxiety symptoms (range 0–21), RRS evaluating ruminative thought patterns (range 8–32), SDS evaluating functional impairment (range 0–30), BEAQ measuring experiential avoidance (range 15–90), PCL assessing PTSD symptoms (range 0–80), ASSIST assessing substance use involvement (range 0–20), PVSS examining positive affect and reward processing (range 21–189) and WHO measuring subjective well-being (range 0–25). Total PHQ-9 scores of 5, 10, 15 and 20 represent cut points for mild, moderate, moderate severe and severe depression, respectively. For evaluation, symptom scores were converted to either a min–max range from 0 to 1, or z-scored. In either case, PVSS and WHO were inverted, so that for them, as for the other scores, a higher value represented more severe symptoms (lower positive valence or greater anhedonia for PVSS and worse well-being for WHO).
Neuroimaging data acquisition
Fifteen minutes of eyes-open resting-state MEG data were recorded with a 306-channel MEG system (TRIUX or TRIUXneo, MEGIN Oy, Helsinki, Finland; 204 planar gradiometers and 102 magnetometers) at the BioMag Laboratory, HUS Medical Imaging Center, Helsinki, Finland or at MEG Core, Aalto University, Espoo, Finland. Bipolar horizontal and vertical electrooculography and electrocardiography were recorded for detection of eye movements and cardiac artifacts. Participants were instructed to sit in a dimly lit room and to focus on a fixation cross. T1-weighted anatomical MRI scans were obtained with a 3-tesla whole-body MRI scanner (Magnetom Skyra, Siemens) at AMI Centre, Aalto University at a resolution of 0.8 × 0.8 × 0.8 mm, repetition time of 2,530 ms and echo time of 3.42 ms.
MEG data preprocessing and source modeling
Temporal signal space separation (tSSS) in the Maxfilter software (Elekta Neuromag) was applied for extracranial noise suppression from MEG sensors, bad channels interpolation and head motion compensation. The 50-Hz line noise and its harmonics were removed with a Finite Impulse Response (FIR) notch filter. Independent components analysis was used to remove ocular, heartbeat and muscle artifacts. FreeSurfer software (https://surfer.nmr.mgh.harvard.edu/) was used for volumetric segmentation of MRI data, surface reconstruction, flattening and cortical parcellation. We performed source reconstruction using minimum norm estimation (MNE) with the MNE software (https://mne.tools/stable/index.html. The forward model was built with a surface-based source space with 5-mm spacing and a single layer (inner skull) symmetric boundary element method. Noise covariance matrices were estimated from preprocessed data filtered to 151–249 Hz. To estimate vertex fidelity, we applied forward and inverse operators to complex white-noise time series, and then computed the correlation between original and forward-inverse-modeled time series79. The obtained fidelity-weighted inverse operators were used for collapsing vertex time series into the 200 parcels of the Schaefer atlas80. Broadband parcel time series were then filtered into narrowband time series with 32 Morlet wavelets with center frequencies spanning from 2.1 to 59.3 Hz in log-linear space.
Oscillation-based FC
PS and AC are two intrinsic modes of oscillation-based FC. We applied wPLI81 to assess PS and oCC to measure AC, which are maximally insensitive to false-positive interactions arising from source leakage52,82.
PS was computed between two time series x(t) and y(t) with wPLI as
$${rm{wPLI}}=frac{|frac{1}{n}sum ({rm{imag}}(S_{xy}))|}{frac{1}{n}sum {lfloor }{rm{imag}}(S_{xy}){rfloor }},$$
where Sxy is the cross-spectrum of x(t) and y(t) and imag is the imaginary part.
AC was computed between the amplitude envelopes of the narrowband time series x(t) and y(t) with oCC, where the time series x(t) is orthogonalized with respect to y(t) (refs. 50,83).
AC and PS were computed between all pairs of parcels and for each Morlet wavelet frequency. The resulting adjacency matrices were represented as weighted graphs53. As a measure of global connectivity, we used GS that was computed as the mean connectivity between all parcel pairs. As a measure of local connectivity, we used NS that was computed by averaging the connectivity strength (wPLI or oCC) of a given parcel with all other parcels.
To reduce the risk of conflating general demographic trends, we regressed out the effects of age and sex for PS and AC NS values with multivariate linear regression.
Statistical analysis between the MDD and HC cohorts
Statistical analyses were performed to compare power, PS and AC between the MDD and HC cohorts both at the graph and parcel levels. At the graph level, the GS for each frequency was compared between two cohorts using a two-tailed Mann–Whitney U test (P < 0.05). Multiple comparisons were corrected separately for PS and AC using the Benjamini–Hochberg FDR method. At the parcel level, power and NS at each parcel and each frequency was similarly compared between the MDD and HC groups using a two-tailed Mann–Whitney U test. To remove false positives from multiple comparisons, we discarded from the significant findings as many of the least-significant comparisons as expected by the alpha level at 0.05, that is 2.5% or 5 significant parcels for each tail at each frequency. We then further estimated the threshold Q of additionally expected false positives to account for multiple comparisons across frequencies84,85.
Brain–symptom associations and statistical analysis
PLSC
Multivariate brain–symptom correlations were obtained with PLSC16,86,87. PLSC extracts latent components which can maximize the common information shared between two datasets by projecting raw data into a low-dimensional space. For two given matrices X and Y, where X contains vectorized connectivity data from N participants and Y contains the behavioral data from the same participants, singular value decomposition (SVD) is applied to the cross-covariance matrix R between X and Y, resulting in low-dimensional matrices: U, S and V:
where (R={Y}^{T}X). Note that R is also a Pearson’s correlation matrix, because X and Y are expressed as z scores. U and V are behavioral and imaging saliences, which represent the contribution of the raw features on the latent components. Then, the latent components are computed by projecting the raw matrices onto the saliences:
where LX and LY are called brain scores and behavior scores, respectively. Imaging and behavioral structure coefficients (or ‘loadings’), corr(X,LX) and corr(Y,LY) are computed with Pearson’s correlation. Compared with saliences, loadings are recommended to present the contributions of raw features to latent components due to the multicollinearity of data and easy interpretation (values are bounded between –1 and 1).
Statistical analysis
To examine how the fixed-effect model can be extended to a random-effect model that applies to the broader population, we followed well-established approaches86,87. Statistical significance of the latent components was obtained using a permutation test by randomly shuffling the order of X 1,000 times and building null distributions of singular values. To test the generalizability and stability of loadings, we created 1,000 bootstrap samples by sampling with replacement and estimated the standard errors for each element’s loading of each latent variable from bootstrap samples. As the ratios of loadings and the corresponding standard errors are akin to a z score, the loadings where absolute values of ratios were larger than 2 were considered significantly stable. A technical problem with permutations and bootstrapping is that resampling may cause axis rotation and reflection, which can make a random-effect model not comparable to the fixed-effect model. We applied Procrustes rotation to correct the rotations and reflections in saliences86,87.
Identification of phenotypes and statistical analysis
We used significant latent components to identify phenotypes with the Leiden community detection algorithm, designed to identify non-overlapping communities from a network56. The key parameter of the Leiden method is the resolution that determines the scale of community detection, yielding a balance between finer, smaller clusters and coarser, larger ones. This adaptability enables the clustering granularity to align with the structural complexity of the data.
The patient–patient Euclidean distances (dissimilarity matrix) were computed with the selected latent components and then transferred to the similarity matrix using the transformation ({rm{similarity}}=displaystylefrac{1}{1+{rm{distance}}}), which was used as input for Leiden clustering. We performed Leiden clustering at multiple resolutions, obtaining a partition for each resolution, and calculated the modularity as a function of resolution.
To assess the statistical significance of each partition, we implemented a permutation-based significance test to generate a null distribution of modularity for each resolution by randomly permuting the assignment of patients to clusters for 1,000 times and derived the mean and the 99th percentile modularity values from this null distribution. The elbow method was used to determine the optimal partitions based on significant modularity values.
Given the sample size of our study, we also performed an in-sample replication analysis to evaluate the reproducibility and generalizability of the identified depression phenotypes. We repeated the entire phenotyping pipeline, from brain–symptom association analysis to clustering, 1,000 times, each time using a randomly selected 80% subset of the full clinical cohort. To assess cluster stability, we then calculated the probability that a given pair of patients were assigned to the same cluster across the iterations in which both patients were included.
Finally, we performed a cross-validation analysis to test whether we could classify individuals to correct clusters. For each of the five clusters, we labeled the samples in that cluster as one class and samples from the remaining four clusters as the other class. We then applied the decision tree classifier with 5-fold cross-validation and 100 runs to predict the cluster membership for each patient, yielding classification accuracy for each patient and the mean classification accuracy for individual clusters.
Characterization of phenotypes and statistical analysis
To assess how connectivity in each phenotype deviates from that in the HC group, we performed statistical testing on GS and NS between each depression phenotype and the HC group for each frequency. For GS, pairwise statistical analyses were conducted using the two-tailed Mann–Whitney U test at P < 0.05, corrected for multiple comparisons using the Benjamini–Hochberg procedure. At the parcel level, NS at each parcel and each frequency was similarly compared between each cluster and HC group using a two-tailed Mann–Whitney U test. To remove false positives from multiple comparisons, we first discarded from the significant findings as many of the least-significant comparisons as predicted by the alpha level of 0.05, that is 2.5% or five significant parcels for each tail at each frequency. We then further estimated the threshold Q of additionally expected false positives to account for multiple comparisons across frequencies and clusters84,85.
In addition, we assessed differences in the two significant brain scores between each pair of depression phenotypes with the two-tailed Mann–Whitney U test at P < 0.05, corrected with the Benjamini–Hochberg method for multiple comparison correction.
For comparing and visualizing the symptom profiles of the discovered phenotypes, all symptom scores were z-scored across the whole clinical cohort, so that the zero circles on the spider plots represents the mean of all patients. For each symptom scale, we assessed the statistical differences between patients in one phenotype against others with a bootstrap resampling procedure (N = 1,000). We estimated the bootstrap mean value and the confidence intervals at the alpha level of 0.05 (confidence limits from 2.5th–97.5th percentiles) for one phenotype and the others. If the bootstrap mean value of the other phenotypes is out of the range of confidence intervals of this phenotype, the differences will be considered significant. Age and sex differences between pairs of clusters were evaluated using the two-tailed Mann–Whitney U test and the chi-square test, respectively, with a significance threshold of P < 0.05. The Benjamini–Hochberg procedure was applied to control the FDR in multiple comparisons.
Reporting summary
Further information on research design is available in the Nature Portfolio Reporting Summary linked to this article.
Data availability
The raw datasets generated and analyzed in the current study are not publicly available because they contain information that could compromise research participant privacy or consent. A minimal dataset that can be used to reproduce the main findings of this study is available via Dryad at https://doi.org/10.5061/dryad.4b8gthts3 (ref. 88).
Code availability
MRI data were processed using FreeSurfer software (v.7.3.2) (https://surfer.nmr.mgh.harvard.edu/). MEG preprocessing and source reconstruction was done with the MNE-python package (https://mne.tools/stable/index.html). Code for computing phase synchrony and amplitude correlations is available in the toolbox CrocoPy (https://github.com/palvalab/crocopy). Code for conducting PLSC analysis was customized from the myPLS toolbox (https://github.com/MIPLabCH/myPLS), and the customized code is available via GitHub at https://github.com/Wenya-Liu/PLSC-functions/tree/main. For the Leiden clustering method, we used the leidenalg package (https://github.com/vtraag/leidenalg).
References
-
Holma, K. M. et al. Incidence and predictors of suicide attempts in DSM-IV major depressive disorder: a five-year prospective study. Am. J. Psychiatry 167, 801–808 (2010).
-
Hyman, S. E. Can neuroscience be integrated into the DSM-V?. Nat. Rev. Neurosci. 8, 725–732 (2007).
-
Cuthbert, B. et al. The future of DSM: role of candidate biomarkers and biological factors. Am. J. Psychiatry 183, 317–324 (2026).
-
Kaiser, R. H., Andrews-Hanna, J. R., Wager, T. D. & Pizzagalli, D. A. Large-scale network dysfunction in major depressive disorder: a meta-analysis of resting-state functional connectivity. JAMA Psychiatry 72, 603–611 (2015).
-
Chai, Y. et al. Functional connectomics in depression: insights into therapies. Trends Cogn. Sci. 27, 814–832 (2023).
-
Spellman, T. & Liston, C. Toward circuit mechanisms of pathophysiology in depression. Am. J. Psychiatry 177, 381–390 (2020).
-
Lynch, C. J. et al. Frontostriatal salience network expansion in individuals in depression. Nature 633, 624–633 (2024).
-
Drysdale, A. T. et al. Resting-state connectivity biomarkers define neurophysiological subtypes of depression. Nat. Med. 23, 28–38 (2017).
-
Furman, D. J., Hamilton, J. P. & Gotlib, I. H. Frontostriatal functional connectivity in major depressive disorder. Biol. Mood Anxiety Disord. 1, 11 (2011).
-
Sheline, Y. I. et al. The default mode network and self-referential processes in depression. Proc. Natl Acad. Sci. USA 106, 1942–1947 (2009).
-
Zhou, H.-X. et al. Rumination and the default mode network: meta-analysis of brain imaging studies and implications for depression. NeuroImage 206, 116287 (2020).
-
Liston, C. et al. Default mode network mechanisms of transcranial magnetic stimulation in depression. Biol. Psychiatry 76, 517–526 (2014).
-
Mulders, P. C., van Eijndhoven, P. F., Schene, A. H., Beckmann, C. F. & Tendolkar, I. Resting-state functional connectivity in major depressive disorder: a review. Neurosci. Biobehav. Rev. 56, 330–344 (2015).
-
Schultz, D. H. et al. Global connectivity of the fronto-parietal cognitive control network is related to depression symptoms in the general population. Netw. Neurosci. 3, 107–123 (2019).
-
Piguet, C., Karahanoğlu, F. I., Saccaro, L. F., Van De Ville, D. & Vuilleumier, P. Mood disorders disrupt the functional dynamics, not spatial organization of brain resting state networks. NeuroImage Clin. 32, 102833 (2021).
-
Vieira, S. et al. Multivariate brain–behaviour associations in psychiatric disorders. Transl. Psychiatry 14, 231 (2024).
-
Xia, C. H. et al. Linked dimensions of psychopathology and connectivity in functional brain networks. Nat. Commun. 9, 3003 (2018).
-
Kebets, V. et al. Fronto-limbic neural variability as a transdiagnostic correlate of emotion dysregulation. Transl. Psychiatry 11, 545 (2021).
-
Chen, D. et al. Neurophysiological stratification of major depressive disorder by distinct trajectories. Nat. Ment. Health 1, 863–875 (2023).
-
Liang, S. et al. Biotypes of major depressive disorder: neuroimaging evidence from resting-state default mode network patterns. NeuroImage Clin. 28, 102514 (2020).
-
Dunlop, K. et al. Dimensional and categorical solutions to parsing depression heterogeneity in a large single-site sample. Biol. Psychiatry 96, 422–434 (2024).
-
Sun, X. et al. Mapping neurophysiological subtypes of major depressive disorder using normative models of the functional connectome. Biol. Psychiatry 94, 936–947 (2023).
-
Tozzi, L. et al. Personalized brain circuit scores identify clinically distinct biotypes in depression and anxiety. Nat. Med. 30, 2076–2087 (2024).
-
Winter, N. R. et al. A systematic evaluation of machine learning-based biomarkers for major depressive disorder. JAMA Psychiatry 81, 386–395 (2024).
-
Baillet, S. Magnetoencephalography for brain electrophysiology and imaging. Nat. Neurosci. 20, 327–339 (2017).
-
Fries, P. Rhythms for cognition: communication through coherence. Neuron 88, 220–235 (2015).
-
Palva, S. & Palva, J. M. Discovering oscillatory interaction networks with M/EEG: challenges and breakthroughs. Trends Cogn. Sci. 16, 219–230 (2012).
-
Engel, A. K., Gerloff, C., Hilgetag, C. C. & Nolte, G. Intrinsic coupling modes: multiscale interactions in ongoing brain activity. Neuron 80, 867–886 (2013).
-
Thut, G., Miniussi, C. & Gross, J. The functional importance of rhythmic activity in the brain. Curr. Biol. 22, R658–R663 (2012).
-
Uhlhaas, P. J. et al. Magnetoencephalography as a tool in psychiatric research: current status and perspective. Biol. Psychiatry Cogn. Neurosci. Neuroimaging 2, 235–244 (2017).
-
Anderson, K. M. et al. Convergent molecular, cellular, and cortical neuroimaging signatures of major depressive disorder. Proc. Natl Acad. Sci. USA 117, 25138–25149 (2020).
-
Fee, C., Banasr, M. & Sibille, E. Somatostatin-positive gamma-aminobutyric acid interneuron deficits in depression: cortical microcircuit and therapeutic perspectives. Biol. Psychiatry 82, 549–559 (2017).
-
Fingelkurts, A. A. & Fingelkurts, A. A. Altered structure of dynamic electroencephalogram oscillatory pattern in major depression. Biol. Psychiatry 77, 1050–1060 (2015).
-
Smart, O. L., Tiruvadi, V. R. & Mayberg, H. S. Multimodal approaches to define network oscillations in depression. Biol. Psychiatry 77, 1061–1070 (2015).
-
Allen, J. J. B., Urry, H. L., Hitt, S. K. & Coan, J. A. The stability of resting frontal electroencephalographic asymmetry in depression. Psychophysiology 41, 269–280 (2004).
-
Pizzagalli, D. A. Frontocingulate dysfunction in depression: toward biomarkers of treatment response. Neuropsychopharmacology 36, 183–206 (2011).
-
Bruder, G. E. et al. Electroencephalographic alpha measures predict therapeutic response to a selective serotonin reuptake inhibitor antidepressant: pre- and post-treatment findings. Biol. Psychiatry 63, 1171–1177 (2008).
-
Dai, Z. et al. Gamma oscillations of visual cortex underlying emotion and cognition deficits associated with suicide attempt in major depressive disorder. Nat. Ment. Health 2, 924–934 (2024).
-
Xue, L. et al. Abnormal beta bursts of depression in the orbitofrontal cortex and its relationship with clinical symptoms. J. Affect. Disord. 369, 1168–1177 (2025).
-
Wu, W. et al. An electroencephalographic signature predicts antidepressant response in major depression. Nat. Biotechnol. 38, 439–447 (2020).
-
Voetterl, H. T. S. et al. Alpha peak frequency-based Brainmarker-I as a method to stratify to pharmacotherapy and brain stimulation treatments in depression. Nat. Ment. Health 1, 1023–1032 (2023).
-
Li, J. et al. Individualized spectral features in first-episode and drug-naïve major depressive disorder: insights from periodic and aperiodic EEG analysis. Biol. Psychiatry Cogn. Neurosci. Neuroimaging 10, 574–586 (2025).
-
Watts, D. et al. Predicting treatment response using EEG in major depressive disorder: a machine-learning meta-analysis. Transl. Psychiatry 12, 332 (2022).
-
Schwartzmann, B. et al. Modulation of neural oscillations in escitalopram treatment: a Canadian biomarker integration network in depression study. Transl. Psychiatry 14, 432 (2024).
-
Whitton, A. E. et al. Electroencephalography source functional connectivity reveals abnormal high-frequency communication among large-scale functional networks in depression. Biol. Psychiatry Cogn. Neurosci. Neuroimaging 3, 50–58 (2018).
-
Nugent, A. C. et al. Multilayer MEG functional connectivity as a potential marker for suicidal thoughts in major depressive disorder. NeuroImage Clin. 28, 102378 (2020).
-
Haegens, S., Cousijn, H., Wallis, G., Harrison, P. J. & Nobre, A. C. Inter- and intra-individual variability in alpha peak frequency. Neuroimage 92, 46–55 (2014).
-
Javed, E. et al. A shift toward supercritical brain dynamics predicts Alzheimer’s disease progression. J. Neurosci. 45, e0688242024 (2025).
-
Siems, M. & Siegel, M. Dissociated neuronal phase- and amplitude-coupling patterns in the human brain. NeuroImage 209, 116538 (2020).
-
Hipp, J. F., Hawellek, D. J., Corbetta, M., Siegel, M. & Engel, A. K. Large-scale cortical correlation structure of spontaneous oscillatory activity. Nat. Neurosci. 15, 884–890 (2012).
-
Siebenhühner, F., Palva, J. M. & Palva, S. Linking the microarchitecture of neurotransmitter systems to large-scale MEG resting state networks. iScience 27, 111111 (2024).
-
Palva, J. M. et al. Ghost interactions in MEG/EEG source space: a note of caution on inter-areal coupling measures. NeuroImage 173, 632–643 (2018).
-
Bullmore, E. & Sporns, O. Complex brain networks: graph theoretical analysis of structural and functional systems. Nat. Rev. Neurosci. 10, 186–198 (2009).
-
Fuscà, M. et al. Brain criticality predicts individual levels of inter-areal synchronization in human electrophysiological data. Nat. Commun. 14, 4736 (2023).
-
Winter, N. R. et al. Quantifying deviations of brain structure and function in major depressive disorder across neuroimaging modalities. JAMA Psychiatry 79, 879–888 (2022).
-
Traag, V. A., Waltman, L. & van Eck, N. J. From Louvain to Leiden: guaranteeing well-connected communities. Sci. Rep. 9, 5233 (2019).
-
Beijers, L., Wardenaar, K. J., van Loo, H. M. & Schoevers, R. A. Data-driven biological subtypes of depression: systematic review of biological approaches to depression subtyping. Mol. Psychiatry 24, 888–900 (2019).
-
Varela, F., Lachaux, J. P., Rodriguez, E. & Martinerie, J. The brainweb: phase synchronization and large-scale integration. Nat. Rev. Neurosci. 2, 229–239 (2001).
-
Leuchter, A. F., Hunter, A. M., Krantz, D. E. & Cook, I. A. Rhythms and blues: modulation of oscillatory synchrony and the mechanism of action of antidepressant treatments. Ann. N. Y. Acad. Sci. 1344, 78–91 (2015).
-
Lin, L. C. & Sibille, E. Somatostatin, neuronal vulnerability and behavioral emotionality. Mol. Psychiatry 20, 377–387 (2015).
-
Siddiqi, S. H. & Fox, M. D. Targeting symptom-specific networks with transcranial magnetic stimulation. Biol. Psychiatry 95, 502–509 (2024).
-
Ulrich, S. et al. Alterations in resting-state EEG functional connectivity in patients with major depressive disorder receiving electroconvulsive therapy: a systematic review. Neurosci. Biobehav. Rev. 169, 106017 (2025).
-
Benschop, L. et al. Electrophysiological scarring in remitted depressed patients: elevated EEG functional connectivity between the posterior cingulate cortex and the subgenual prefrontal cortex as a neural marker for rumination. J. Affect. Disord. 281, 493–501 (2021).
-
Salk, R. H., Hyde, J. S. & Abramson, L. Y. Gender differences in depression in representative national samples: meta-analyses of diagnoses and symptoms. Psychol. Bull. 143, 783–822 (2017).
-
Cyranowski, J. M., Frank, E., Young, E. & Shear, M. K. Adolescent onset of the gender difference in lifetime rates of major depression: a theoretical model. Arch. Gen. Psychiatry 57, 21–27 (2000).
-
Lobier, M., Palva, J. M. & Palva, S. High-alpha band synchronization across frontal, parietal and visual cortex mediates behavioral and neuronal effects of visuospatial attention. NeuroImage 165, 222–237 (2018).
-
Miljevic, A., Bailey, N. W., Murphy, O. W., Perera, M. P. N. & Fitzgerald, P. B. Alterations in EEG functional connectivity in individuals with depression: a systematic review. J. Affect. Disord. 328, 287–302 (2023).
-
Hamilton, J. P. et al. Default-mode and task-positive network activity in major depressive disorder: implications for adaptive and maladaptive rumination. Biol. Psychiatry 70, 327–333 (2011).
-
Sheline, Y. I., Price, J. L., Yan, Z. & Mintun Resting-state functional MRI in depression unmasks increased connectivity between networks via the dorsal nexus. Proc. Natl Acad. Sci. USA 107, 11020–11025 (2010).
-
Sobin, C. & Sackeim, H. A. Psychomotor symptoms of depression. Am. J. Psychiatry 154, 4–17 (1997).
-
Wüthrich, F. et al. The neural signature of psychomotor disturbance in depression. Mol. Psychiatry 29, 317–326 (2024).
-
Daskalakis, N. P. et al. Systems biology dissection of PTSD and MDD across brain regions, cell types, and blood. Science 384, eadh3707 (2024).
-
Grandy, T. H. et al. Individual alpha peak frequency is related to latent factors of general cognitive abilities. NeuroImage 79, 10–18 (2013).
-
Bangasser, D. A. & Cuarenta, A. Sex differences in anxiety and depression: circuits and mechanisms. Nat. Rev. Neurosci. 22, 674–684 (2021).
-
Labaka, A., Goñi-Balentziaga, O., Lebeña, A. & Pérez-Tejada, J. Biological sex differences in depression: a systematic review. Biol. Res. Nurs. 20, 383–392 (2018).
-
Kuehner, C. Why is depression more common among women than among men?. Lancet Psychiatry 4, 146–158 (2017).
-
Jaworska, N., Blier, P., Fusee, W. & Knott, V. α Power, α asymmetry and anterior cingulate cortex activity in depressed males and females. J. Psychiatr. Res. 46, 1483–1491 (2012).
-
Sheehan, D. V. et al. The Mini International Neuropsychiatric Interview (M.I.N.I.): the development and validation of a structured diagnostic psychiatric interview. J. Clin Psychiatry 59, 22–33 (1998).
-
Korhonen, O., Palva, S. & Palva, J. M. Sparse weightings for collapsing inverse solutions to cortical parcellations optimize M/EEG source reconstruction accuracy. J. Neurosci. Methods 226, 147–160 (2014).
-
Schaefer, A. et al. Local-global parcellation of the human cerebral cortex from intrinsic functional connectivity MRI. Cereb. Cortex 28, 3095–3114 (2018).
-
Vinck, M., Oostenveld, R., van Wingerden, M., Battaglia, F. & Pennartz, C. M. A. An improved index of phase-synchronization for electrophysiological data in the presence of volume-conduction, noise and sample-size bias. NeuroImage 55, 1548–1565 (2011).
-
Myrov, V. et al. CROCOpy—a Python toolbox for the analysis of CRitical Oscillations and COnnectivity. Preprint at bioRxiv https://doi.org/10.64898/2026.02.17.706438 (2026).
-
Brookes, M. J., Woolrich, M. W. & Barnes, G. R. Measuring functional connectivity in MEG: a multivariate approach insensitive to linear source leakage. NeuroImage 63, 910–920 (2012).
-
Puoliväli, T., Palva, S. & Palva, J. M. Influence of multiple hypothesis testing on reproducibility in neuroimaging research: a simulation study and Python-based software. J. Neurosci. Methods 337, 108654 (2020).
-
Haque, H. et al. Top-down selection of visual working memory contents is supported by alpha-band phase-synchronized oscillatory networks. Imaging Neurosci. 3, IMAG-a (2025).
-
Krishnan, A., Williams, L. J., McIntosh, A. R. & Abdi, H. Partial Least Squares (PLS) methods for neuroimaging: a tutorial and review. NeuroImage 56, 455–475 (2011).
-
McIntosh, A. R. & Lobaugh, N. J. Partial least squares analysis of neuroimaging data: applications and advances. NeuroImage 23, S250–S263 (2004).
-
Liu, W. et al. Data from: MEG oscillation-based functional connectivity identifies clinically relevant depression phenotypes. Dryad https://doi.org/10.5061/dryad.4b8gthts3 (2026).
Acknowledgements
We thank all the participants for their time and contributions to this study.
Funding
This work was supported by Ella and Georg Ehrnrooth Foundation to W.L., Finnish Cultural Foundation grants 00220945 and 00242647 to F.S. Work on ‘PlaStim: Plasticity Stimulation in the Treatment of Anhedonia’ was supported by Wellcome Leap as part of the Multi-Channel Psych Program to S.P. and J.M.P. Open Access funding provided by University of Helsinki (including Helsinki University Central Hospital).
Ethics declarations
Competing interests
J.M.P. and J.J.J. are shareholders in Soihtu DTx Ltd., which develops digital therapeutics for major depressive disorder and holds intellectual property transferred from Aalto University with J.M.P., J.J.J. and S.P. as co-inventors. J.M.P. is a part-time and J.J.J. and A.S. are active employees at Soihtu DTx. Soihtu DTx Ltd. did not play a role in the design, conduct, data analysis or funding of the study. The other authors declare no competing interests.
Peer review
Peer review information
Nature Mental Health thanks Haiteng Jiang and the other, anonymous, reviewer(s) for their contribution to the peer review of this work.
Additional information
Publisher’s note Springer Nature remains neutral with regard to jurisdictional claims in published maps and institutional affiliations.
Supplementary information
Rights and permissions
Open Access This article is licensed under a Creative Commons Attribution 4.0 International License, which permits use, sharing, adaptation, distribution and reproduction in any medium or format, as long as you give appropriate credit to the original author(s) and the source, provide a link to the Creative Commons licence, and indicate if changes were made. The images or other third party material in this article are included in the article’s Creative Commons licence, unless indicated otherwise in a credit line to the material. If material is not included in the article’s Creative Commons licence and your intended use is not permitted by statutory regulation or exceeds the permitted use, you will need to obtain permission directly from the copyright holder. To view a copy of this licence, visit http://creativecommons.org/licenses/by/4.0/.
About this article

Cite this article
Liu, W., Vesterinen, M., Andersson, A. et al. Magnetoencephalography oscillation-based functional connectivity identifies clinically relevant depression phenotypes. Nat. Mental Health (2026). https://doi.org/10.1038/s44220-026-00723-4
-
Received:
-
Accepted:
-
Published:
-
Version of record:
-
DOI: https://doi.org/10.1038/s44220-026-00723-4
Leave a Reply