⏱ 4 min read
Main
Approximately one in eight people worldwide live with a mental disorder, and this number continues to rise1. According to studies by the Global Burden of Disease, neuropsychiatric disorders are among the leading causes of disability and are important risk factors for premature mortality2. These disorders have profound psychological and psychiatric effects on the workforce and impose a substantial economic burden on society3. Neuropsychiatric disorders such as schizophrenia (SCZ), major depressive disorder (MDD), bipolar disorder (BIP), autism spectrum disorder (ASD) and attention deficit hyperactivity disorder (ADHD) are characterized by their moderate heritability and peak age at onset in childhood or adolescence4. Despite this, the underlying biological mechanisms remain poorly understood, limiting progress in early detection and effective treatment.
Twin studies have provided empirical evidence of the genetic contributions to neuropsychiatric disorders5,6,7,8 and genome-wide association studies (GWAS) have identified hundreds of genetic loci associated with multiple neuropsychiatric disorders9,10,11,12,13,14,15. However, most associated variants lie in non-coding regions16,17, making it difficult to infer their regulatory roles or downstream biological effects. Genetic variants associated with neuropsychiatric disorders may influence disease risk through regulatory mechanisms, including effects on DNA methylation and gene expression, captured by methylation quantitative trait loci (meQTLs) and expression quantitative trait loci (eQTLs). Integrative approaches that combine genetic and functional genomic data can help bridge this gap by mapping genetic risk to molecular mechanisms. Mendelian randomization (MR) further enables the inference of putative causal relationships between these molecular intermediates and disease outcomes, leveraging genetic instruments to move beyond correlation toward causal insight.
Although neuropsychiatric disorders primarily affect the brain, increasing evidence suggests that peripheral tissues, especially blood, can provide meaningful molecular insights into psychiatric risk. This is particularly relevant for disorders with known immune involvement, such as SCZ, MDD, BIP, ASD and ADHD18,19,20,21,22,23,24,25,26,27,28. Multiple studies have reported systemic inflammation and immune dysregulation in these disorders, and GWAS have consistently implicated immune-related pathways, especially in SCZ and MDD9,29. Blood-based methylation and gene expression profiles can reflect such systemic immune alterations and may capture upstream regulatory mechanisms that affect both peripheral and central systems30. Moreover, blood-derived molecular QTLs are highly accessible and scalable for population-based research, particularly in adolescents, where brain tissue is not available. While blood may not fully represent brain-specific mechanisms, it offers a valuable proxy for identifying peripheral biomarkers and genetically anchored regulatory pathways with potential relevance to neurodevelopmental and psychiatric conditions31.
However, existing multi-omics studies in psychiatry have been limited by a focus on adult samples, single disorders or correlational designs. This has left a significant gap in understanding how early molecular regulatory mechanisms may contribute to shared and distinct psychiatric risk across disorders during adolescence, the developmental window when many of these conditions first emerge.
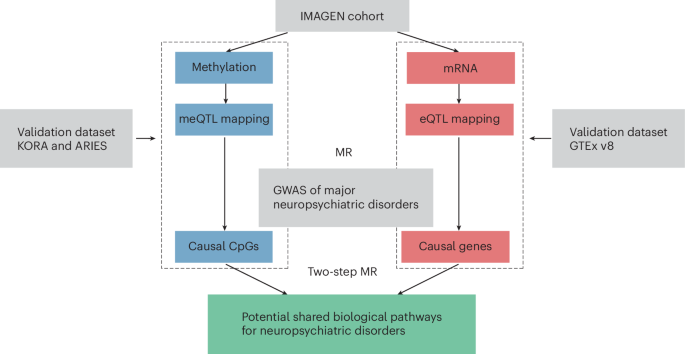
In this study, we address this gap by generating and analyzing a multi-omic QTL resource in adolescents and uncover putative causal mechanisms underlying neuropsychiatric disorders. We performed genome-wide analyses of meQTLs and eQTLs in blood samples from 14-year-old participants in the IMAGEN cohort, with replication in KORA32, ARIES33 and GTEx v8 (ref. 34). Using MR and colocalization analyses, we integrated these QTLs with GWAS summary statistics for six neuropsychiatric disorders: ADHD, ASD, BIP, MDD, SCZ and insomnia (INS). Our goals were to (1) identify CpG sites and genes with genetically informed causal associations to psychiatric risk during adolescence, (2) assess which features are transdiagnostic versus disorder specific, and (3) apply two-step MR to explore regulatory pathways linking DNA methylation to gene expression and disease risk. These findings provide new insights into adolescent molecular mechanisms of psychiatric disorders and potential transdiagnostic targets for early intervention. Figure 1 illustrates the study design.

Schematic workflow to investigate the shared regulatory pathways across major neuropsychiatric disorders through integration of genomic, epigenomic and transcriptomic profiles.
Results
Description of the IMAGEN cohort
The IMAGEN study is a multicenter longitudinal adolescent cohort that aims to explore the genetic, behavioral and neurobiological underpinnings of individual differences for neurocognition and neurodevelopment35. Approximately 2,000 healthy adolescents, aged 14 at baseline, were recruited across 8 European sites (Berlin, Dresden, Dublin, Hamburg, London, Mannheim, Nottingham and Paris), with follow-up visits at 16, 19 and 23 years old. Our study focuses on the multi-omics data collected at baseline. Genotype, blood-derived DNA methylation and RNA expression data were available for 1,324, 1,274 and 545 participants at baseline, respectively.
Genome-wide identification and validation of cis-meQTLs
Pairwise genome-wide associations between 5.9 million single nucleotide polymorphisms (SNPs) and DNA methylation at 372,582 CpG sites from 1,274 IMAGEN participants were analyzed to identify cis-meQTLs36, defined as SNPs significantly associated with DNA methylation, and residing within a 2-megabase (Mb) window of the associated CpG site. After Bonferroni correction (that is, P < 3.1 × 10⁻¹¹ for 1.6 × 10⁹ cis-SNP–CpG pair associations), a total of 9,105,155 cis-meQTL–CpG pairs (comprising 2,196,765 cis-meQTLs and 58,525 CpG sites) were identified.
These findings were replicated (Bonferroni-corrected P < 1 × 10⁻¹⁴) in 2 independent datasets: KORA, a study with participants of European and South Asian ancestries32, and ARIES, an adolescent cohort33. In KORA, 32.49% (N = 2,958,057) and 39.77% (N = 3,621,238) of the cis-meQTL–CpG pairs were replicated when using samples from the same ancestry (that is, European) and from South Asian ancestry, respectively. Allelic effects were highly concordant among these replicated cis-meQTLs, with concordance observed for 99.97% (N = 2,957,003) and 99.94% (N = 3,619,041) of the replicated cis-meQTLs in the European and South Asian samples, respectively (Fig. 2a,b). Correlations of t values were also extremely high (r = 0.95 and 0.93 in the European and South Asian sample, respectively). In ARIES, 15.20% (N = 1,383,576) of the identified cis-meQTL–CpG pairs were replicated, among which 98.8% (N = 1,366,292) concorded for direction of effect (Fig. 2c). Again, the correlation of t values in this comparison was remarkably high (r = 0.94).
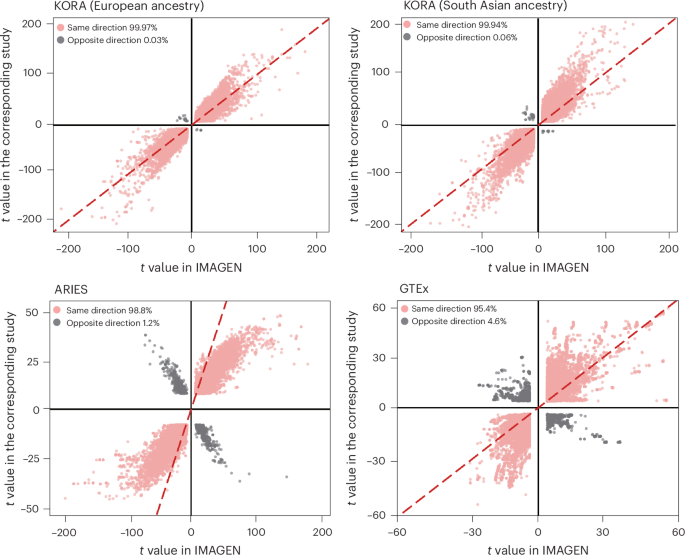
t values of cis-meQTLs identified in IMAGEN were plotted against those from KORA (European ancestry (top left) and South Asian ancestry (top right)) and ARIES (adolescents of European ancestry; bottom left). t values of cis-eQTLs identified in IMAGEN were plotted against those from GTEx (bottom right). Points in red indicate the same effect direction between SNP–CpG and SNP–mRNA pairs. The 45° dashed line indicates identical t values in IMAGEN and the corresponding validation cohort. A total of 100,000 SNP–CpG and SNP–mRNA pairs were randomly selected for better visualization.
Genome-wide identification and validation of cis-eQTLs
Pairwise association between 5.9 million SNPs and 19,840 mRNA expression profiles from 545 IMAGEN adolescents were used to map cis-eQTLs34 within a 2-Mb window. A total of 358,616 cis-eQTL–mRNA pairs (comprising 280,161 cis-eQTLs and 4,524 mRNAs) were identified (false discovery rate (FDR)-corrected P value (PFDR) < 0.05). Of these, 48.26% (N = 173,081) were replicated (PFDR < 0.05) in the GTEx v8 dataset34. Directions of effects were highly consistent for 95.36% (N = 165,051) of the replicated cis-eQTL–mRNA pairs (correlation of t values = 0.80; Fig. 2d).
Identification of putatively causal CpGs for neuropsychiatric disorders
We next used two-sample MR analyses to identify putatively causal (hereafter named as causal) CpGs for neuropsychiatric disorders. Disorders used as outcome measures included ADHD, ASD, BIP, MDD, SCZ and INS.
First, to derive valid instrumental variables (IVs), all cis-meQTLs identified in IMAGEN were clumped using a linkage disequilibrium (LD) threshold of r2 < 0.01 within a 2-Mb window, resulting in 10,986 independent cis-meQTLs (associated with 7,669 CpGs). Next, these independent cis-meQTLs were associated to GWAS summary statistics for ADHD, ASD, BIP, SCZ, MDD and INS (Supplementary Table 1). For each disorder, CpGs associated with at least 3 independent cis-meQTLs were selected as exposure variables in the MR analyses (1,267 candidate CpGs for ADHD, 1,509 for ASD, 1,324 for BIP and SCZ, 1,131 for MDD and 1,233 for INS) and independent cis-meQTLs were used as genetic instruments. After Bonferroni correction, a total of 73 unique causal CpGs were identified (Supplementary Table 2a). These included 3 CpGs for ADHD, 1 for ASD, 9 for BIP, 58 for SCZ, 12 for MDD and 2 for INS. Nine CpGs were causal for more than one neuropsychiatric disorder (Fig. 3). Notably, cg19624444 was simultaneously causal for ADHD, BIP, SCZ and MDD. This CpG is located within MAD1L1, whose differential DNA methylation was previously found to be associated with SCZ37 and phenotypes of depression38. Intriguingly, the direction of effects for cg19624444 methylation differed across disorders, with hypermethylation associated with ADHD (odds ratio (OR) = 3.03, P = 1 × 10⁻⁵) and MDD (OR = 1.67, P = 4 × 10⁻¹⁰) and hypomethylation associated with BIP (OR = 0.45, P = 2 × 10⁻⁵) and SCZ (OR = 0.44, P = 1 × 10⁻⁶) (Fig. 4a). All other CpGs causal for multiple disorders were located on chromosome 6. These included four CpGs (cg00330953, cg13187827, cg19593741 and cg10095777) within the SAPCD1-AS1/VWA7 gene region, causal for both SCZ and MDD, and three CpGs (cg20802826, cg05419812 and cg08801479) causal for both SCZ and BIP.
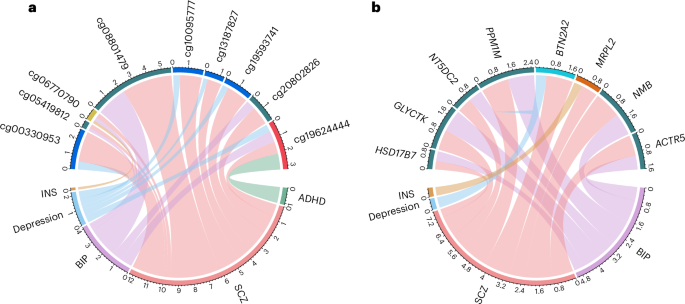
a,b, The causal CpGs (a) and causal genes (b) are shown. Each neuropsychiatric disorder is represented by a specific color, and the width of each curve represents the effect size of the causal CpGs or genes on the corresponding disorder (wider curves indicate larger absolute effect sizes). Numbers indicate correlations between corresponding CPG/gene and neuropsychiatric disorder.
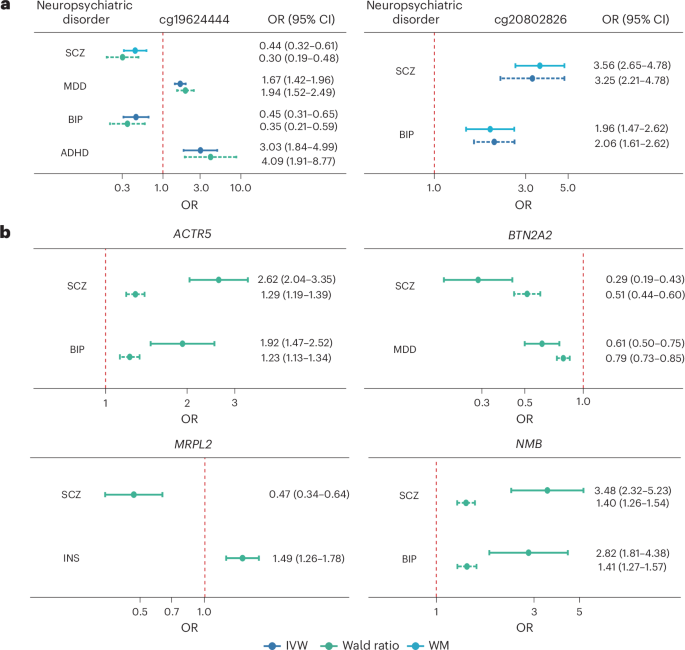
a,b, Two-sample MR was used to identify causal CpGs (a) and causal genes (b) for each neuropsychiatric disorder based on the GWAS summary statistic (neff = 128,214 for ADHD, neff = 389,523 for BIP, neff = 1,816,976 for MDD, neff = 313,750 for INS and neff = 233,471 for SCZ). eff, effective. Solid lines represent causal estimates using cis-meQTLs (n = 1,274) and cis-eQTLs (n = 545) identified in IMAGEN as the genetic instruments, and the dashed line represents the replicated estimates using cis-meQTLs from KORA European ancestry (n = 3,799) datasets and cis-eQTLs from GTEx (n = 488), with different MR methods (indicated by colors) adopted as appropriate. The error bar indicates the 95% confidence interval of the OR estimates, derived from the s.e. of the MR effect estimate.
To replicate these findings, we repeated the MR analysis using published meQTL summary statistics of European ancestry in KORA32. A total of 56 causal CpGs were replicated, among which 35 CpGs (62.5%) showed consistent effect directions. In addition, 29 (51.8%) CpGs achieved smaller P values after meta-analyzing with the discovery MR, supporting their high reliability.
Comparisons of DNA methylation in blood and brain tissues (3 cortical regions and cerebellum) sampled from the same individuals revealed that, for 64% of the replicated CpGs, correlations between blood and brain were significant (Supplementary Table 2b). These were positively correlated, except for cg19624444, the CpG causal for ADHD, BIP, SCZ and MDD, for which correlations between blood and brain (that is, prefrontal cortex, superior temporal cortex and cerebellum) were negative (r = −0.49 to −0.58).
Identification of putatively causal genes for neuropsychiatric disorders
To investigate differences in gene expression as potential mechanisms underlying SNP–disease associations in neuropsychiatric disorders, we again used MR analysis. Following clumping using r2 < 0.01 as the LD threshold, 9,579 cis-eQTLs (associated with 6,864 genes) were identified in the IMAGEN cohort and used as the genetic instruments. Those cis-eQTLs overlapping with the GWAS summary statistics for each disorder were then taken forward for each MR analysis, resulting in approximately 4,000 differentially expressed genes (3,974 genes for ADHD, 3,864 genes for ASD, 4,186 genes for BIP, 4,186 genes for SCZ, 4,190 genes for MDD and 3,838 genes for INS) being analyzed. After Bonferroni correction for multiple testing, a total of 62 unique genes were identified as putatively causal for at least 1 neuropsychiatric disorder (that is, 2 causal genes for ADHD, 1 for ASD, 16 for BIP, 7 for MDD, 1 for INS and 43 for SCZ) based on their expression levels in blood (Supplementary Table 3a). Among these, eight were causal for more than one neuropsychiatric disorder.
We leveraged eQTLs identified from the GTEx v8 dataset to replicate these findings. A total of 47 causal genes were replicated when considering blood eQTLs, among which 39 (82.3%) showed consistent effect directions with the discovery sample, and 25 (53.2%) achieved smaller P values after meta-analyzing with the discovery MR (Fig. 3 and Supplementary Table 3a). Figure 4b shows the replicated causal genes that share their effects across more than one disorder. Expression of BTN2A2 was causal for MDD and SCZ, and MRPL2 was causal for INS and SCZ, while that of other genes (for example, ACTR5 and NMB) was causal for BIP and SCZ. It is also worth noting that the gene located within cg196244444 mentioned earlier, MAD1L1, is also a causal gene for SCZ. Further considering eQTL effects in 11 brain tissues, we found that among the causal genes identified in the IMAGEN sample, 28 were also causal for neuropsychiatric disorders through their differential expression in brain tissues (Supplementary Table 3b).
Characterization of identified QTLs, CpGs and genes
To explore biological mechanisms underlying the SNP–disease associations, we conducted positional, tissue-specific and pathway enrichment analyses on the meQTLs (N = 34,758) and eQTLs (N = 14,360) mapped to putatively causal CpGs and genes, respectively. As shown in Fig. 5a,b, positional enrichment analyses indicated that both causal cis-meQTLs and cis-eQTLs were enriched in intergenic regions and depleted in intronic regions (fold enrichmentmeQTLs = 1.34 and 0.75, fold enrichmenteQTLs = 1.13 and 0.83, all P < 1 × 10⁻¹⁶), consistent with previous findings that intergenic regions often harbor regulatory elements16,17.
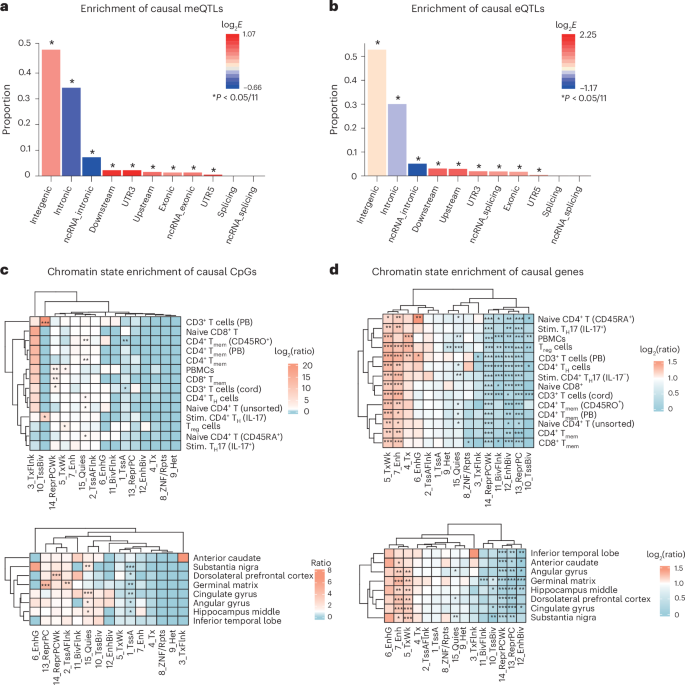
a,b, Enrichment analysis of meQTLs and eQTLS mapped to causal CpGs and causal genes. Both causal cis-meQTLs (a) and cis-eQTLs (b) were enriched in intergenic regions while depleted in intronic regions (all P < 1 × 10⁻¹⁶). A two-sided hypergeometric test was used, with the Bonferroni-corrected significance threshold provided. c,d, Chromatin state enrichment of the causal CpGs (c) and genes (d) across blood and brain tissues, based on the core 15-state ChromHMM model defined by the NIH Roadmap Epigenomics Mapping Consortium. A two-sided hypergeometric test was used, with the Benjamini–Hochberg FDR method used for multiple testing correction. E, fold enrichment; BivFlnk, flanking bivalent transcription start sites and enhancer; CD3+ T cells (cord), primary CD3+ T cells from cord blood; CD3+ T cells (PB), primary CD3+ T cells from peripheral blood; CD4+ TH cells, primary CD4+ T helper cells from peripheral blood (CD25−); CD4+ Tmem (PB), primary CD4+ effector/memory T cells from peripheral blood (CD25int, CD127+); Enh, enhancers; EnhBiv, bivalent enhancer; EnhG, genic enhancers; Het, heterochromatin; naive CD4+ T (CD45RA+), primary naive CD4+ T helper cells; ncRNA, non-coding RNA; PBMCs, peripheral blood mononuclear primary cells; Quies, quiescent or low activity; ReprPC, repressed polycomb; ReprPCWk, weak repressed polycomb; stim., stimulated; Treg cells, primary CD4+ regulatory T cells from peripheral blood (CD25+, CD127−); TssA, active transcription start sites; TssAFlnk, flanking active transcription start sites; TssBiv, bivalent/poised transcription start sites; Tx, strong transcription; TxFlnk, transcription at 5′ and 3′ gene ends; TxWk, weak transcription; UTR, untranslated region; ZNF/Rpts, zinc finger genes and repeats.
To further characterize the regulatory landscape, we assessed chromatin state enrichment using the 15-state ChromHMM model from the Roadmap Epigenomics Project39 across brain and blood tissues (Supplementary Table 4). Causal CpGs (n = 85; Supplementary Table 2a) were significantly enriched in bivalent promoter regions in primary T cells from peripheral blood—a chromatin state associated with transcriptional silencing of key developmental genes, while maintaining them in a poised state for activation. In brain tissues, these CpGs were enriched in quiescent chromatin and depleted from actively transcribed regions, suggesting a role in developmentally regulated or repressed epigenetic contexts (Fig. 5c). By contrast, causal genes (n = 70; Supplementary Table 3a) showed strong and consistent enrichment across tissues in active regulatory states, including enhancers and regions of ongoing transcription, and were depleted in repressive chromatin states (Fig. 5d). These findings support the role of causal genes in dynamic transcriptional regulation relevant to neuropsychiatric risk.
Chromosome 6 (chr. 6p21 and chr. 6p22) was significantly enriched for causal CpGs, while chromosome 3 (chr. 3p21) was significantly enriched for causal genes (Supplementary Fig. 1). Causal genes tended to be expressed at significantly lower levels in several brain regions (for example, anterior cingulate, basal ganglia, amygdala, hippocampus, hypothalamus and cortex) and in the pancreas and liver (Supplementary Fig. 2). Unsurprisingly, causal genes and genes mapping to causal CpGs were significantly enriched for genes identified in GWAS for ASD, SCZ and BIP. They were also significantly enriched for genes implicated in diabetes and autoimmune diseases, such as ulcerative colitis and asthma (Supplementary Figs. 3–5), suggesting potential overlap between the genomic architecture of autoimmune diseases and neuropsychiatric disorders.
Multi-omics integrative regulatory pathways for neuropsychiatric disorders
To further explore potential regulatory mechanisms underlying neuropsychiatric disorders, we conducted two additional analyses. First, we performed two-step MR analyses to identify causal genes mediating the effects of causal CpGs on these disorders. This analysis revealed 30 causal CpG–gene pairs, with 6 genes (that is, PGBD1, ATXN1, HLA-DRB1, MRPL2, NT5DC1 and MAD1L1) identified as key mediators (Supplementary Table 5). Notably, certain CpG sites were found to exert causal effects through multiple genes. For instance, decreased expression of MRPL2 mediated the effects of cg06770790 methylation on both INS and SCZ, whereas reduced NT5DC1 expression mediated the effect of this CpG methylation on BIP. In addition, six CpGs causal for SCZ (cg00330953, cg10095777, cg13187827, cg19593741, cg23287992 and cg25264948) were linked to opposing regulatory effects on two genes: increasing HLA-DRB1 expression while simultaneously decreasing expression of PGBD1. The proportion of effect mediated via these causal genes ranged between 12.7% and 89.3% (Supplementary Table 6).
Next, we performed colocalization analyses on the 30 CpG–gene pairs identified above to determine if the neuropsychiatric disorders and their biological mediators (that is, DNA methylation and mRNA expression) shared common causal genetic variants. Our findings revealed strong evidence of colocalization (posterior probability >0.94) for six CpG–gene pairs associated with INS or SCZ (Fig. 6 and Supplementary Table 7). For SCZ, a causal meQTL (rs4639400, associated with the methylation of cg18302629) colocalized with an eQTL that increased MAD1L1 expression (Fig. 6a). In addition, four causal meQTLs (rs796969016, rs7383287, rs28539606 and rs796302616, associated with the methylation of cg08801479, cg11469594, cg03461499 and cg13187827, respectively) colocalized with eQTLs that influenced HLA-DRB1 expression (Fig. 6d–g). Moreover, a causal meQTL (rs73736735, associated with decreased cg06770790 methylation) colocalized with a causal eQTL associated with increased MRPL2 expression (Fig. 6b,c). Importantly, both cg06770790 methylation and MRPL2 expression were found to be causal for both INS and SCZ.
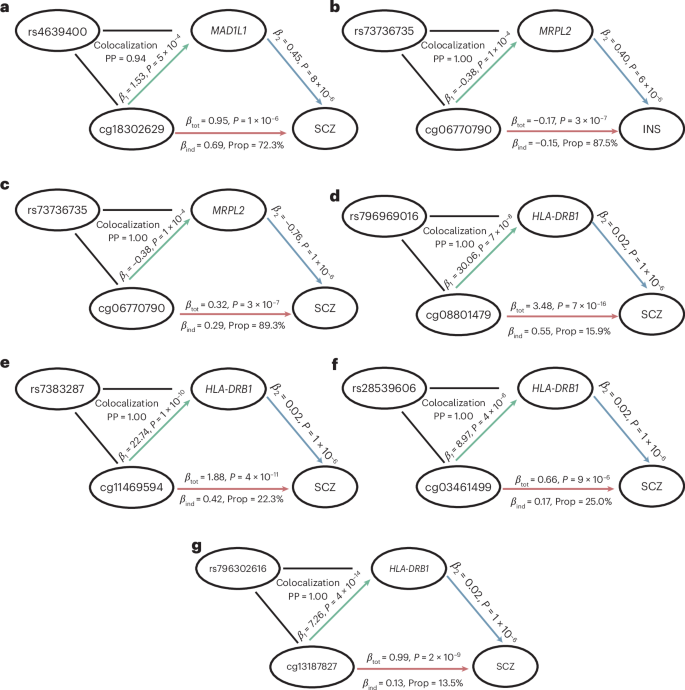
Two-step MR and colocalization analyses were conducted to reveal the regulatory pathways shared by multiple neuropsychiatric disorders. First, the colocalization analysis was conducted to identify CpG–gene pairs that share causal variants. Next, the indirect effect of CpG methylation on each neuropsychiatric disorder through gene expression (βind) was calculated by multiplying the effect of CpG methylation on gene expression (β1) and the effect of gene expression on neuropsychiatric disorder (β2). The proportion mediated (Prop) was calculated by dividing βind by the total effect of CpG methylation on neuropsychiatric disorder (βtot). a, MAD1L1 expression mediated the effect of cg18302629 methylation on SCZ. b,c, MRPL2 expression mediated the effects of cg06770790 on both INS (b) and SCZ (c), indicating possible shared regulatory mechanisms for INS and SCZ. d–g, HLD-DRB1 plays an important role in the regulatory mechanisms for SCZ by mediating the methylation of four CpG sites: cg08801479 (d), cg11469594 (e), cg03461499 (f) and cg13187827 (g). PP, posterior probability.
To assess the robustness of our findings, we reran key MR analyses using updated GWAS datasets for ADHD, BIP and MDD14,40,41. The results (Supplementary Table 8a,b) were largely consistent with the original analyses, with overlapping CpG sites and similar effect directions. Notably, the increased power of the updated MDD GWAS led to the identification of 32 putatively causal genes—substantially more than the 7 genes detected using the earlier dataset. Despite these additions, the core mechanisms highlighted in Fig. 6 remained unchanged, reinforcing the stability of our conclusions.
Discussion
Our study offers a comprehensive resource of meQTLs and eQTLs in adolescent populations, providing a valuable platform to explore the multi-omic mechanisms underlying diseases, particularly those emerging in late childhood and early adolescence. Using a large-scale multicenter adolescent cohort, we identified over 9 million cis-meQTLs and 550,000 cis-eQTLs, more than double the numbers reported in previous adolescent studies33. These QTLs were validated in two independent datasets, demonstrating strong concordance in allelic effect directions upon replication. By leveraging this resource to investigate casual disease mechanisms across six neuropsychiatric disorders, our MR analyses identified causal CpG sites and genes, either unique to or shared among disorders. Combined with colocalization analyses, our findings uncovered potential transdiagnostic regulatory mechanisms. Notably, the expression of three genes—MAD1L1, MRPL2 and HLA-DRB1—was shown to mediate the causal effects of CpG methylation on SCZ and INS. Specifically, decreased MRPL2 expression due to methylation at cg06770790 was causal for both INS and SCZ, while increased expression of MAD1L1 and HLA-DRB1, driven by methylation at several CpG sites (cg18302629, cg11469594, cg08801479, cg13187827 and cg03461499), was linked to SCZ. These findings provide crucial insights into key regulatory mechanisms and genes involved in neuropsychiatric disorders, highlighting potential therapeutic targets.
Several studies have previously linked DNA methylation to common mental disorders42,43,44,45,46,47,48,49,50,51,52, including candidate gene studies from postmortem human brain tissues50,53. Our study, however, goes beyond existing research by identifying causal CpGs using accessible tissues such as blood. Most of the causal CpGs we identified had not been found in previous epigenome-wide association studies54 (https://ngdc.cncb.ac.cn/ewas), with only a minority (33.3%; 4 of 12) having been reported in epigenome-wide association studies for MDD55, whereas none have been reported for other disorders. This difference likely stems from our focus on identifying causal, rather than downstream, effects of DNA methylation on disorders. In addition, the majority of existing epigenome-wide association studies are based on adult populations, with limited studies focusing on adolescents, largely due to the scarcity of large-scale datasets.
Interestingly, 13.25% of the causal meQTLs identified in our study achieved genome-wide significance in GWAS of corresponding disorders, underscoring the relevance of DNA methylation to disease risk. Among the CpGs identified, cg19624444 in MAD1L1 was particularly noteworthy, showing opposite directionality across disorders: hypermethylation in blood associated with ADHD and MDD, and hypomethylation with BIP and SCZ. The tissue-specific effects are consistent with previous reports38, although some discrepancies between blood and brain findings warrant further investigation37,56.
Our eQTL-based analyses also validated a substantial number of genes previously reported in transcriptome-wide association studies57 (https://ngdc.cncb.ac.cn/twas/), with 40.0% (28 of 70) detected in blood transcriptome-wide association studies and 61.4% (43 of 70) across all tissues, confirming the robustness of our findings. Causal CpGs showed enrichment in the major histocompatibility complex region on chromosome 6 (chr. 6p21–p22), a known immune hotspot, while causal genes were notably enriched on chromosome 3p2. These genes also showed downregulation in several brain regions (for example, putamen, anterior cingulate, hippocampus and cortex) and in peripheral tissues, including pancreas, blood and liver. Moreover, causal CpGs and genes were significantly enriched for GWAS loci associated not only with ASD, SCZ and BIP but also with autoimmune diseases, such as type 1 diabetes, ulcerative colitis and asthma, supporting a potential shared immune–neuropsychiatric genetic architecture27,58,59,60,61. Chromatin state enrichment analyses further indicated that causal CpGs were significantly enriched in bivalent promoter regions in primary T cells—epigenetic regions associated with silenced but poised transcription of lineage-specific genes—and in quiescent chromatin regions in the brain. This pattern suggests that these CpGs may lie in developmentally regulated or immune-responsive regulatory elements. By contrast, causal genes showed consistent enrichment in active chromatin states (for example, enhancers and transcriptionally active regions) across both brain and blood, reinforcing their potential involvement in dynamic transcriptional programs relevant to neuropsychiatric and immune-related pathways. Both causal cis-meQTLs and cis-eQTLs were enriched in intergenic regions and depleted in intronic regions, consistent with previous work showing that intergenic regions are often involved in transcriptional regulation, while intronic regions are more commonly associated with post-transcriptional processes such as alternative splicing16,17. These distinct functional roles may have implications for how genetic variation influences gene regulation and may help prioritize regulatory elements as potential therapeutic targets. This regulatory localization aligns with the observed chromatin state enrichments and supports the functional relevance of the identified variants.
Several genes, such as BTN2A2 and NMB, were transdiagnostic and showed differential expression, suggesting complex roles in both immune and neural systems. For example, BTN2A2, which was causal for MDD and SCZ and showed differential expression across blood and brain—and was previously found to be overexpressed in the hippocampus of patients with SCZ62—is known to modulate T cell-mediated immune responses63,64,65. By contrast, NMB was causal for both BIP and SCZ, with effects mediated by increased expression in blood and brain tissues. However, the varying expression profile of this gene across developmental stages and tissues may also contribute to these disorders66.
Further mechanistic insights emerged from our integrated genotype–DNA methylation–gene expression analyses. For example, both INS and SCZ were linked to elevated MRPL2 expression, driven by reduced methylation at cg06770790. MRPL2 encodes a mitochondrial ribosomal protein, supporting a role for mitochondrial dysfunction in psychiatric disorders67. Increased expression of MAD1L1 and HLA-DRB1, driven by CpG methylation, was also causal for SCZ. MAD1L1 has previously been linked to SCZ in GWAS60,68,69 and DNA methylation studies37. Human and animal models have shown that this gene, a component of the mitotic spindle-assembly checkpoint, is involved in neuronal migration and neurite outgrowth, thereby contributing to SCZ pathology70. Similarly, HLA-DRB1, part of the HLA complex involved in immune system regulation and a region whose differential methylation has been linked to multiple diseases, including rheumatoid arthritis, cancer, psoriasis and multiple sclerosis71,72,73,74,75, is implicated in disease pathology. Together, these findings highlight converging roles for mitochondrial function, neurodevelopmental processes and immune regulation in the epigenetic architecture of SCZ and INS, underscoring the potential of integrated multi-omic approaches to uncover biologically meaningful and therapeutically relevant mechanisms in psychiatric disorders.
The absence of detectable transdiagnostic CpG–gene mediation effects in disorders other than SCZ and INS likely reflects a combination of biological, methodological and technical limitations. Several disorders (for example, BIP, ADHD and ASD) are associated with smaller GWAS sample sizes, lower SNP-based heritability and weaker polygenic signals76, reducing statistical power. High clinical and genetic heterogeneity, particularly in MDD77,78, may obscure consistent regulatory pathways and affect MR precision. In some disorders, environmental influences may contribute more prominently to epigenetic architecture, limiting the sensitivity of genetically anchored instruments (for example, mQTLs and eQTLs). The smaller sample size of the gene expression dataset limited the identification of independent cis-eQTLs, necessitating a more permissive approach to IV selection in MR analyses. This may introduce bias, and future studies with larger transcriptomic cohorts are needed to validate these findings and refine the implicated regulatory networks. Crucially, MR-based inference relies on the assumption that genetic instruments affect the outcome solely via the exposure (for example, DNA methylation). This can be violated in the presence of horizontal pleiotropy, such as when cis-meQTLs alter transcription factor binding or gene expression independently of methylation. Although we applied MR-Egger regression to test for pleiotropy and excluded loci with significant intercepts, its limited power, especially with few instruments, means that pleiotropic effects cannot be ruled out. As such, we refer to identified CpGs and genes as putatively causal and stress the need for experimental validation. Further, our two-step MR approach assumes linear mediation from DNA methylation to gene expression to disease, which may not fully capture complex or non-transcriptional mechanisms. The use of cis-instruments in both steps also raises the possibility of pleiotropic effects due to LD. Our reliance on blood-based data and age mismatches between adolescent QTLs and adult GWAS may also reduce sensitivity, particularly for early-onset or brain-specific phenotypes. In addition, although we adjusted for immune cell composition using the first two principal components of estimated cell-type proportions, residual confounding may remain, particularly in relation to enrichments for immune-related signatures. Future studies using single-cell or sorted-cell data will be important to disentangle cell-intrinsic effects from composition-driven signals.
Despite these limitations, our study addresses an important gap by uncovering new insights into the epigenetic and transcriptomic regulation of neuropsychiatric disorders during adolescence, a critical developmental window for disease onset. Our findings highlight key genes and regulatory pathways, particularly those implicated in SCZ and INS, that may serve as promising targets for future therapeutic development across a broader spectrum of neuropsychiatric conditions.
Methods
DNA methylation microarray processing and normalization
Blood DNA methylation was assessed in IMAGEN using the Illumina HumanMethylation450 (450k) microarray, which measures CpG methylation across >485,000 probes covering 99% of the RefSeq gene promoters79, following the manufacturer’s protocols. Quality control and quantile normalization were performed in R using the minfi Bioconductor package80. Briefly, red and green channel intensities were mapped to the methylated and unmethylated status, and average intensities were used to check for low quality samples. Initial quality assessment was performed using the preprocessIllumina option. Principal component analyses were performed using the singular value decomposition method to identify methylation outliers based on the first four components. Samples with intensities more than 3 s.d. away from the median were considered outliers and removed. Intensities from the sex chromosomes were used to predict sex, and samples with discordant predicted and recorded sex were removed. Samples that were initially processed in batches were merged at this stage before further preprocessing. Stratified quantile normalization was then applied across samples. The data were then normalized together using the minfi preprocessQuantile function81. Principal component analyses of normalized β values were used to control for unknown structure in the methylation data. Cell counts for the six major cell types in blood (granulocytes, B cells, CD4+ T cells, CD8+ T cells, monocytes and NK cells) were estimated by implementing the estimateCellCounts function in minfi, which gives sample-specific estimates of cell proportions based on reference information on cell-specific methylation signatures. Analyses involving DNA methylation data were controlled for the first four principal components of the methylation data, sample batches, the first two components of estimated cell-type proportion, recruitment centers (dummy coded) and sex as covariates.
mRNA processing
Gene expression was investigated in 631 participants from the IMAGEN sample for which mRNA expression data were available at the age of 14 (ref. 82). Total RNA was extracted from whole blood cells using the PAXgene Blood RNA Kit and labeled complementary RNA was prepared using the Illumina TotalPrep RNA Amplification kit. Gene expression profiling was performed by Illumina HumanHT-12 v4 Expression BeadChips (Illumina). Expression data were normalized using the mloess method83 and log transformed before analyses. Analyses involving gene expression data were controlled for recruitment centers (dummy coded) and sex as covariates.
SNP genotyping
Genotypes were assessed in IMAGEN using two genotyping arrays. A total of 705 and 1,382 individuals were genotyped using the Illumina Human610-Quad BeadChip and the Illumina Human660-Quad BeadChip arrays, respectively, yielding genotype data for 582,982 markers. Quality control procedures were applied separately for each platform. SNPs were excluded if they had a call rate below 95%, a minor allele frequency less than 5%, significant deviation from Hardy–Weinberg equilibrium (P ≤ 1 × 10⁻³) or were non-autosomal. Individuals with a genotype failure rate exceeding 5% were also excluded. Population homogeneity was assessed using Structure software with HapMap reference populations84, and individuals with divergent ancestry (that is, not clustering with Utah residents of northern and western Europe descent) were removed. In addition, identity-by-state clustering and multidimensional scaling were performed using PLINK 1.90 to detect and exclude closely related individuals. Principal component analysis was then applied to further identify and remove outliers, defined as individuals located more than 4 s.d. from the mean on any of the first 20 principal components. After quality control, genotypes from both platforms were merged and platform-specific SNPs were excluded from subsequent analyses.
cis-meQTL and cis-eQTL mapping
For cis-meQTL mapping in IMAGEN, a 3-step strategy was used due to the computational burden of running 5.9 million SNP × 374,000 CpG linear regression models. In the first step, residuals were obtained by regressing CpG methylation on all covariates, including age, sex, site, top two methylation principal components, wave, cell-type structure and genetic population structure. In the second step, linear regression was used to test the associations between residuals obtained in the first step and SNPs within a 2-Mb window of the corresponding CpG. During this step, candidate CpG–SNP pairs were prefiltered by a prefiltering P value threshold of 1 × 10⁻⁶. Finally, in the third step, associations between CpG methylation and SNPs for the candidate CpG–SNP pairs were recalculated by modeling CpG methylation as the dependent variable, SNP as the independent variable and adjusting for the same covariates in the first step, with a Bonferroni-corrected P value threshold 3.1 × 10⁻¹¹ (0.05/1.6 × 109 cis-CpG–SNP pairs).
For cis-eQTL mapping, we used a similar three-step strategy as used for cis-meQTL mapping. The prefiltering P value threshold was set to 1 × 10⁻³, and the final P value threshold was obtained using FDR correction, following previous studies34.
Validation of cis-meQTLs and cis-eQTLs
Published studies32,33 of cis-meQTL summary statistics were used to validate our results of the cis-meQTL mapping. The KORA study included 3,799 participants of European ancestry and 3,195 participants of South Asian ancestry, with approximately 5 million and 9 million cis-meQTL–CpG pairs identified, respectively. The ARIES study included 837 adolescents of European ancestry and identified about 4 million cis-meQTL–CpG pairs. We used GTEx v8 cis-eQTL from whole blood samples34 to validate our cis-eQTL mapping results. GTEx v8 included 488 whole blood samples of European ancestry and identified about 1.6 million cis-eQTL–gene pairs for autosomes. A Bonferroni-corrected P value threshold was used to identify validated cis-meQTL–CpG pairs in KORA and ARIES, and a P value threshold based on FDR correction was used to identify validated cis-eQTL–gene pairs in GTEx v8.
In validating the cis-meQTLs and cis-eQTLs, we compared our own mapping results with the published results and calculated the coverage and consistency of the effect directions. Coverage is defined as the proportion of pairs in our mapping results that could also be found in the published study. To assess consistency of effect directions for these overlapping pairs, we calculated the proportion of cis-meQTLs with consistent effect directions (based on β values) on CpG methylation among the overlapping pairs.
Identification of putatively causal CpGs and genes for neuropsychiatric disorders
To identify CpG sites and genes with putative causal effects on neuropsychiatric disorders, we applied a two-sample MR framework, in which genetic variants (IVs) associated with DNA methylation or gene expression were identified in the IMAGEN adolescent cohort (exposure dataset) and tested for association with disease outcomes using independent GWAS summary statistics (outcome dataset). This design minimizes confounding and reverse causation, as the instruments are defined independently of disease status. We used publicly available GWAS summary statistics for major psychiatric disorders, including the most comprehensive data available at the time of analysis, including: ADHD85, ASD15, BIP10, MDD11, SCZ9 and INS13. For ADHD, BIP and MDD, we incorporated summary data from the latest Psychiatric Genomics Consortium GWAS14,40,41, which became available during revision. Full details and data sources are listed in Supplementary Table 1.
We first mapped cis-meQTLs and cis-eQTLs in the IMAGEN adolescent cohort and pruned them for LD using a threshold of r2 < 0.01 within a 2-Mb window, based on the 1000 Genomes reference panel86. These LD-independent cis-QTLs were used as IVs to proxy methylation levels at CpG sites or expression of genes in the MR analyses. The two-sample MR design ensures that the exposure (methylation or expression) and the outcome (psychiatric disorder) are assessed in independent datasets, thereby reducing bias from reverse causation and residual confounding, as genetic variants are randomly allocated at conception.
A key assumption of MR is that the genetic instruments only influence the outcome through the exposure of interest (for example, CpG methylation or gene expression). However, this assumption may be violated by horizontal pleiotropy, in which a variant affects both the molecular trait and the disease through separate biological mechanisms. To account for this, we applied MR-Egger regression, which can detect and adjust for directional pleiotropy under the InSIDE (instrument strength independent of direct effect) assumption. We further evaluated consistency of causal effect estimates across multiple MR methods, including inverse variance weighted (IVW) and weighted median (WM) estimators. For CpGs, IVW and WM MR tests were performed only when at least three independent cis-meQTLs were available, which is the minimum required for multi-instrument MR. Where only one instrument was available, Wald ratio estimates were used. In the case of gene expression, we did not impose a minimum number of IVs due to the limited number of independent cis-eQTLs per gene. To assess the validity of MR estimates, we conducted heterogeneity tests and examined MR-Egger intercepts for evidence of directional pleiotropy.
A CpG site or gene was considered to have a significant putative causal effect on a given neuropsychiatric disorder if it satisfied the following criteria: (1) Ppleiotropy > 0.05 (no evidence of directional pleiotropy); (2) Pheterogeneity > 0.05 (no heterogeneity) and Bonferroni-corrected PIVW < 0.05 (that is, PIVW < 0.05 per number of tested CpGs or genes); or, if heterogeneity was present (Pheterogeneity < 0.05), then (3) Bonferroni-corrected PWM < 0.05.
We emphasize that this statistical approach assumes the genetic instruments influence the outcome exclusively through the exposure (that is, DNA methylation or gene expression) and not through pleiotropic pathways. To account for potential violations of this assumption, we compared MR-Egger and IVW estimates and interpreted consistency in effect size and direction as supportive, although not definitive, evidence of robustness. All MR analyses were conducted using the TwoSampleMR 0.5.8 package in R87.
Brain–blood methylation correlation
We interrogated a searchable DNA methylation database88 (https://epigenetics.essex.ac.uk/bloodbrain/) generated from matched DNA samples isolated from whole blood and 4 brain regions (prefrontal cortex, entorhinal cortex, superior temporal gyrus and cerebellum) from 122 individuals to establish the degree to which blood methylation levels at selected loci correlated with their brain methylation patterns. Correlations between blood and brain methylation levels at individual CpG sites were evaluated to indicate the similarity of methylation levels between blood and brain tissues at these sites.
Functional enrichment analyses
SNP and gene-based enrichment analyses were conducted in FUMA89. The SNP2GENE option was used for enrichment analyses of xQTLs (that is, meQTLs and eQTLs) identified in this study.
The GENE2FUNC option was used to investigate potential biological pathways associated with causal genes and the genes closest to causal CpGs. Hypergeometric tests (with Bonferroni-corrected P value) were used to investigate over-representation of genes from multiple pathways. Analyses focused on pathway (KEGG), tissue (GTEx v8) and GWAS catalog-based enrichment analyses.
Chromatin state enrichment analyses
To investigate the functional genomic context of CpGs and genes identified as putatively causal for psychiatric disorders, we performed chromatin state enrichment analyses using the National Institutes of Health (NIH) Roadmap Epigenomics Project’s 15-state ChromHMM model (https://egg2.wustl.edu/roadmap/web_portal/chr_state_learning.html#core_15state). This model integrates multiple histone modification marks to classify the genome into 15 discrete chromatin states, including active transcription start sites, enhancers, transcribed regions, polycomb-repressed domains and quiescent regions. Enrichment was performed separately for causal CpGs and causal genes across a panel of brain tissues (for example, hippocampus, anterior caudate and cingulate gyrus) and blood and T cell types (for example, peripheral blood mononuclear cells and CD4+ and CD8+ T cells). For CpG-level analyses, each causal CpG site was mapped to chromatin state annotations, and its overlap was assessed relative to a background of all tested CpG sites included in the meQTL analysis (N = 372,582). For gene-level analyses, each causal gene was mapped to its genomic span (transcription start to end site), and overlaps with chromatin states were compared with a background set of all genes tested in the eQTL analysis (N = 31,427). Enrichment ratios were calculated as the observed overlap divided by the expected overlap under a null model of random distribution. Statistical significance of enrichment was assessed using hypergeometric tests, and results were visualized as heat maps displaying enrichment ratios across tissues and chromatin states.
Mediation of putatively causal CpGs effects on neuropsychiatric disorders via gene expression
Two-step MR analysis was conducted to assess the role of gene expression on the CpG–neuropsychiatric disorders causal pathway. In the first step, by using causal CpGs as the exposure, corresponding causal cis-meQTLs as the IVs and causal genes on the same chromosome as the outcome, we conducted MR analysis to assess the causal effect of CpGs on gene expression (β1), with Bonferroni-corrected P value thresholds. For example, 7 causal CpGs and 1 causal gene on chromosome 6 were identified for BIP in the previous MR analysis; therefore, the P value threshold for the first step MR of BIP was set as 0.05/(1 × 7). In the second step, for significant CpG–gene pairs identified in the first step, the causal effects of these causal genes to corresponding neuropsychiatric disorders (β2) were estimated via MR analysis, and mediation effects of CpG–neuropsychiatric disorder via gene expression were estimated by multiplying β1 and β2. Finally, proportion mediated via gene expression along the CpG–neuropsychiatric disorder was calculated by dividing mediation effect by the total effect, which is the causal effect of causal CpGs to corresponding disorders.
Colocalization analysis
Colocalization analysis was performed on causal CpG–causal gene pairs identified by two-step MR analysis. Colocalization tests were performed on each CpG–gene pair using corresponding cis-meQTLs and cis-eQTLs. A Bayesian colocalization method implemented in the R package coloc 5.2.3 was used to test the probability of one SNP being causal for both the CpG and gene expression90. In this study, the association results between SNPs and CpGs (at P < 3.1 × 10⁻¹¹) and between SNPs and gene expression (at FDR-corrected P < 0.05) within a 2-Mb window were used as input. Prior probabilities were set as suggested by previous studies36: the probability of a SNP being associated with trait 1 only was 2 × 10⁻¹¹, the probability of a SNP being associated with trait 2 only was 1 × 10⁻⁷ and the probability of a SNP being associated with both traits was 2 × 10⁻¹². A SNP was considered to be colocalized for a CpG and a gene if the posterior probability (PP4) was greater than 90%.
Ethical statement
The IMAGEN study was approved by local ethnical research committees at each research site, including King’s College London (PNM/10/11-126), University of Nottingham (D/11/2007), Trinity College Dublin (SPREC092007-01), Technische Universitat Dresden (EK 235092007), Commissariat a l’Energie Atomique et aux Energies Alternatives, INSERM (2007-A00778-45), University Medical Center at the University of Hamburg (M-191/07) and in Germany by the medical ethics committee of the University of Heidelberg (2007-024N-MA) in accordance with the Declaration of Helsinki. In all studies, informed consent was sought from all participants and from a parent or guardian of each participant if under 18 years of age.
Reporting summary
Further information on research design is available in the Nature Portfolio Reporting Summary linked to this article.
Data availability
All the primary results in this study can be found in the Supplementary Tables. The raw IMAGEN dataset is protected and not available due to data privacy laws. However, it may be obtained upon application by email via https://imagen-project.org/. Public QTL summary statistics from KORA, ARIES and GTEx studies are available as described at https://www.helmholtz-munich.de/en/epi/cohort/kora, http://www.ariesepigenomics.org.uk/ and https://gtexportal.org/home/, respectively. The correlation result between blood and brain methylation levels is available at https://epigenetics.essex.ac.uk/bloodbrain/. The links and references for all the publicly available summary statistics are as follows: ADHD GWAS, https://doi.org/10.6084/m9.figshare.14671965 (ref. 91) and https://doi.org/10.6084/m9.figshare.22564390 (ref. 92); ASD GWAS, https://doi.org/10.6084/m9.figshare.14671989 (ref. 93); BIP GWAS, https://doi.org/10.6084/m9.figshare.14102594 (ref.94) and https://doi.org/10.6084/m9.figshare.27216117 (ref. 95); MDD GWAS, https://datashare.ed.ac.uk/handle/10283/3203 and https://cncr.nl/research/summary_statistics/; INS GWAS, https://doi.org/10.6084/m9.figshare.19426775 (ref. 96); KORA meQTL, https://zenodo.org/record/5196216#.YRZ3TfJxeUk (ref. 97); ARIES meQTL, http://www.mqtldb.org; and GTEx v8 eQTL, www.gtexportal.org.
Code availability
Primary analyses were conducted in R v.4.3.2. MR analyses were performed with the TwoSampleMR 0.5.8 package, and colocalization tests used the coloc 5.2.3 package. Custom code that supports the main findings of this study is available at https://github.com/qian40/causal_pathway_code and will also be available at Code Ocean (https://doi.org/10.24433/CO.5785855.v1) upon publication.
References
-
Charlson, F. et al. New WHO prevalence estimates of mental disorders in conflict settings: a systematic review and meta-analysis. Lancet 394, 240–248 (2019).
-
Whiteford, H. A. Global burden of disease attributable to mental and substance use disorders: findings from the Global Burden of Disease Study 2010. Lancet 382, 1575–1586 (2013).
-
Arias, D., Saxena, S. & Verguet, S. Quantifying the global burden of mental disorders and their economic value. eClinicalMedicine 54, 101675 (2022).
-
Solmi, M. et al. Age at onset of mental disorders worldwide: large-scale meta-analysis of 192 epidemiological studies. Mol. Psychiatry 27, 281–295 (2022).
-
McGuffin, P. et al. The heritability of bipolar affective disorder and the genetic relationship to unipolar depression. Arch. Gen. Psychiatry 60, 497–502 (2003).
-
Rietveld, M. J., Hudziak, J. J., Bartels, M., Van Beijsterveldt, C. & Boomsma, D. I. Heritability of attention problems in children: I. cross-sectional results from a study of twins, age 3–12 years. Am. J. Med. Genet. Part B 117, 102–113 (2003).
-
Sullivan, P. F., Kendler, K. S. & Neale, M. C. Schizophrenia as a complex trait: evidence from a meta-analysis of twin studies. Arch. Gen. Psychiatry 60, 1187–1192 (2003).
-
Sullivan, P. F., Neale, M. C. & Kendler, K. S. Genetic epidemiology of major depression: review and meta-analysis. Am. J. Psychiatry 157, 1552–1562 (2000).
-
Trubetskoy, V. et al. Mapping genomic loci implicates genes and synaptic biology in schizophrenia. Nature 604, 502–508 (2022).
-
Mullins, N. et al. Genome-wide association study of more than 40,000 bipolar disorder cases provides new insights into the underlying biology. Nat. Genet. 53, 817–829 (2021).
-
Howard, D. M. et al. Genome-wide meta-analysis of depression identifies 102 independent variants and highlights the importance of the prefrontal brain regions. Nat. Neurosci. 22, 343–352 (2019).
-
Bellenguez, C. et al. New insights into the genetic etiology of Alzheimer’s disease and related dementias. Nat. Genet. 54, 412–436 (2022).
-
Jansen, P. R. et al. Genome-wide analysis of insomnia in 1,331,010 individuals identifies new risk loci and functional pathways. Nat. Genet. 51, 394–403 (2019).
-
Demontis, D. et al. Genome-wide analyses of ADHD identify 27 risk loci, refine the genetic architecture and implicate several cognitive domains. Nat. Genet. 55, 198–208 (2023).
-
Grove, J. et al. Identification of common genetic risk variants for autism spectrum disorder. Nat. Genet. 51, 431–444 (2019).
-
Consortium, T. G. et al. The Genotype-Tissue Expression (GTEx) pilot analysis: multitissue gene regulation in humans. Science 348, 648–660 (2015).
-
Maurano, M. T. et al. Systematic localization of common disease-associated variation in regulatory DNA. Science 337, 1190–1195 (2012).
-
Al-Haddad, B. J. et al. Long-term risk of neuropsychiatric disease after exposure to infection in utero. JAMA Psychiatry 76, 594–602 (2019).
-
Lydholm, C. N. et al. Parental infections before, during, and after pregnancy as risk factors for mental disorders in childhood and adolescence: a nationwide Danish study. Biol. Psychiatry 85, 317–325 (2019).
-
Benros, M. E. et al. Autoimmune diseases and severe infections as risk factors for mood disorders: a nationwide study. JAMA Psychiatry 70, 812–820 (2013).
-
Benros, M. E. et al. Autoimmune diseases and severe infections as risk factors for schizophrenia: a 30-year population-based register study. Am. J. Psychiatry 168, 1303–1310 (2011).
-
Breithaupt, L. et al. Association of exposure to infections in childhood with risk of eating disorders in adolescent girls. JAMA Psychiatry 76, 800–809 (2019).
-
Köhler-Forsberg, O. et al. A nationwide study in Denmark of the association between treated infections and the subsequent risk of treated mental disorders in children and adolescents. JAMA Psychiatry 76, 271–279 (2019).
-
Hostinar, C. E., Lachman, M. E., Mroczek, D. K., Seeman, T. E. & Miller, G. E. Additive contributions of childhood adversity and recent stressors to inflammation at midlife: findings from the MIDUS study. Dev. Psychol. 51, 1630 (2015).
-
Rohleder, N. Stress and inflammation—the need to address the gap in the transition between acute and chronic stress effects. Psychoneuroendocrinology 105, 164–171 (2019).
-
Miller, A. H. & Raison, C. L. The role of inflammation in depression: from evolutionary imperative to modern treatment target. Nat. Rev. Immunol. 16, 22–34 (2016).
-
Sekar, A. et al. Schizophrenia risk from complex variation of complement component 4. Nature 530, 177–183 (2016).
-
Meltzer, A. & Van de Water, J. The role of the immune system in autism spectrum disorder. Neuropsychopharmacology 42, 284–298 (2017).
-
Wray, N. R. et al. Genome-wide association analyses identify 44 risk variants and refine the genetic architecture of major depression. Nat. Genet. 50, 668–681 (2018).
-
Jansen, R. et al. Gene expression in major depressive disorder. Mol. Psychiatry 21, 339–347 (2016).
-
Walton, E. et al. Epigenetic profiling of ADHD symptoms trajectories: a prospective, methylome-wide study. Mol. Psychiatry 22, 250–256 (2017).
-
Hawe, J. S. et al. Genetic variation influencing DNA methylation provides insights into molecular mechanisms regulating genomic function. Nat. Genet. 54, 18–29 (2022).
-
Gaunt, T. R. et al. Systematic identification of genetic influences on methylation across the human life course. Genome Biol. 17, 61 (2016).
-
Consortium, G. The GTEx Consortium atlas of genetic regulatory effects across human tissues. Science 369, 1318–1330 (2020).
-
Mascarell Maričić, L. et al. The IMAGEN study: a decade of imaging genetics in adolescents. Mol. Psychiatry 25, 2648–2671 (2020).
-
Huan, T. et al. Genome-wide identification of DNA methylation QTLs in whole blood highlights pathways for cardiovascular disease. Nat. Commun. 10, 4267 (2019).
-
McKinney, B. C. et al. Schizophrenia-associated differential DNA methylation in brain is distributed across the genome and annotated to MAD1L1, a locus at which DNA methylation and transcription phenotypes share genetic variation with schizophrenia risk. Transl. Psychiatry 12, 340 (2022).
-
Sokolov, A. V. et al. Methylation in MAD1L1 is associated with the severity of suicide attempt and phenotypes of depression. Clin. Epigenetics 15, 1 (2023).
-
Kundaje, A. et al. Integrative analysis of 111 reference human epigenomes. Nature 518, 317–330 (2015).
-
Adams, M. J. et al. Trans-ancestry genome-wide study of depression identifies 697 associations implicating cell types and pharmacotherapies. Cell 188, 640–652.e9 (2025).
-
O’Connell, K. S. et al. Genomics yields biological and phenotypic insights into bipolar disorder. Nature 639, 968–975 (2025).
-
Hing, B. et al. Chronic social stress induces DNA methylation changes at an evolutionary conserved intergenic region in chromosome X. Epigenetics 13, 627–641 (2018).
-
Lutz, P.-E. et al. Association of a history of child abuse with impaired myelination in the anterior cingulate cortex: convergent epigenetic, transcriptional, and morphological evidence. Am. J. Psychiatry 174, 1185–1194 (2017).
-
Nagy, C. et al. Astrocytic abnormalities and global DNA methylation patterns in depression and suicide. Mol. Psychiatry 20, 320–328 (2015).
-
Feinberg, A. P. & Fallin, M. D. Epigenetics at the crossroads of genes and the environment. JAMA 314, 1129–1130 (2015).
-
Ludwig, B. & Dwivedi, Y. Dissecting bipolar disorder complexity through epigenomic approach. Mol. Psychiatry 21, 1490–1498 (2016).
-
Rao, J., Keleshian, V., Klein, S. & Rapoport, S. Epigenetic modifications in frontal cortex from Alzheimer’s disease and bipolar disorder patients. Transl. Psychiatry 2, e132–e132 (2012).
-
Ladd-Acosta, C. et al. Common DNA methylation alterations in multiple brain regions in autism. Mol. Psychiatry 19, 862–871 (2014).
-
Abdolmaleky, H. M. et al. DNA hypermethylation of serotonin transporter gene promoter in drug naive patients with schizophrenia. Schizophr. Res. 152, 373–380 (2014).
-
Ruzicka, W. B., Subburaju, S. & Benes, F. M. Circuit-and diagnosis-specific DNA methylation changes at γ-aminobutyric acid–related genes in postmortem human hippocampus in schizophrenia and bipolar disorder. JAMA Psychiatry 72, 541–551 (2015).
-
Mertens, J. et al. Differential responses to lithium in hyperexcitable neurons from patients with bipolar disorder. Nature 527, 95–99 (2015).
-
Klengel, T. et al. Allele-specific FKBP5 DNA demethylation mediates gene–childhood trauma interactions. Nat. Neurosci. 16, 33–41 (2013).
-
Iwamoto, K. et al. DNA methylation status of SOX10 correlates with its downregulation and oligodendrocyte dysfunction in schizophrenia. J. Neurosci. 25, 5376–5381 (2005).
-
Xiong, Z. et al. EWAS Open Platform: integrated data, knowledge and toolkit for epigenome-wide association study. Nucleic Acids Res. 50, D1004–D1009 (2022).
-
Shen, X. et al. DNA methylome-wide association study of genetic risk for depression implicates antigen processing and immune responses. Genome Med. 14, 36 (2022).
-
Jaffe, A. E. et al. Mapping DNA methylation across development, genotype and schizophrenia in the human frontal cortex. Nat. Neurosci. 19, 40–47 (2016).
-
Lu, M. et al. TWAS Atlas: a curated knowledgebase of transcriptome-wide association studies. Nucleic Acids Res. 51, D1179–D1187 (2023).
-
Andreassen, O. A. et al. Genetic pleiotropy between multiple sclerosis and schizophrenia but not bipolar disorder: differential involvement of immune-related gene loci. Mol. Psychiatry 20, 207–214 (2015).
-
Iakunchykova, O., Leonardsen, E. H. & Wang, Y. Genetic evidence for causal effects of immune dysfunction in psychiatric disorders: where are we? Transl. Psychiatry 14, 63 (2024).
-
Pantelis, C. et al. Biological insights from 108 schizophrenia-associated genetic loci. Nature 511, 421–427 (2014).
-
Elmer, B. M. & McAllister, A. K. Major histocompatibility complex class I proteins in brain development and plasticity. Trends Neurosci. 35, 660–670 (2012).
-
Sinkus, M. L., Adams, C. E., Logel, J., Freedman, R. & Leonard, S. Expression of immune genes on chromosome 6p21.3-22.1 in schizophrenia. Brain Behav. Immun. 32, 51–62 (2013).
-
Arnett, H. A. & Viney, J. L. Immune modulation by butyrophilins. Nat. Rev. Immunol. 14, 559–569 (2014).
-
Sarter, K. et al. Btn2a2, a T cell immunomodulatory molecule coregulated with MHC class II genes. J. Exp. Med. 213, 177–187 (2016).
-
Smith, I. A. et al. BTN1A1, the mammary gland butyrophilin, and BTN2A2 are both inhibitors of T cell activation. J. Immunol. 184, 3514–3525 (2010).
-
Hall, L. S. et al. Cis-effects on gene expression in the human prenatal brain associated with genetic risk for neuropsychiatric disorders. Mol. Psychiatry 26, 2082–2088 (2021).
-
Liu, L. et al. Mitochondria-wide association study observed significant interactions of mitochondrial respiratory and the inflammatory in the development of anxiety and depression. Transl. Psychiatry 13, 216 (2023).
-
Ripke, S. et al. Genome-wide association analysis identifies 13 new risk loci for schizophrenia. Nat. Genet. 45, 1150–1159 (2013).
-
Ikeda, M. et al. A genome-wide association study identifies two novel susceptibility loci and trans population polygenicity associated with bipolar disorder. Mol. Psychiatry 23, 639–647 (2018).
-
Goo, B. S. et al. Schizophrenia-associated Mitotic Arrest Deficient-1 (MAD1) regulates the polarity of migrating neurons in the developing neocortex. Mol. Psychiatry 28, 856–870 (2023).
-
Xu, J. et al. Epigenome-wide methylation haplotype association analysis identified HLA-DRB1, HLA-DRB5 and HLA-DQB1 as risk factors for rheumatoid arthritis. Int. J. Immunogenet. 50, 291–298 (2023).
-
Berglund, A. et al. Methylation of immune synapse genes modulates tumor immunogenicity. J. Clin. Investig. 130, 974–980 (2020).
-
Nie, Y. et al. DNA hypermethylation is a mechanism for loss of expression of the HLA class I genes in human esophageal squamous cell carcinomas. Carcinogenesis 22, 1615–1623 (2001).
-
Chen, M. et al. Hypermethylation of HLA-C may be an epigenetic marker in psoriasis. J. Dermatol. Sci. 83, 10–16 (2016).
-
Kular, L. et al. DNA methylation as a mediator of HLA-DRB1*15:01 and a protective variant in multiple sclerosis. Nat. Commun. 9, 2397 (2018).
-
Andreassen, O. A., Hindley, G. F., Frei, O. & Smeland, O. B. New insights from the last decade of research in psychiatric genetics: discoveries, challenges and clinical implications. World Psychiatry 22, 4–24 (2023).
-
Cai, N. et al. Minimal phenotyping yields genome-wide association signals of low specificity for major depression. Nat. Genet. 52, 437–447 (2020).
-
Nguyen, T.-D. et al. Genetic heterogeneity and subtypes of major depression. Mol. Psychiatry 27, 1667–1675 (2022).
-
Sandoval, J. et al. Validation of a DNA methylation microarray for 450,000 CpG sites in the human genome. Epigenetics 6, 692–702 (2011).
-
Aryee, M. J. et al. Minfi: a flexible and comprehensive Bioconductor package for the analysis of Infinium DNA methylation microarrays. Bioinformatics 30, 1363–1369 (2014).
-
Touleimat, N. & Tost, J. Complete pipeline for Infinium Human Methylation 450K BeadChip data processing using subset quantile normalization for accurate DNA methylation estimation. Epigenomics 4, 325–341 (2012).
-
Jia, T. et al. Epigenome-wide meta-analysis of blood DNA methylation and its association with subcortical volumes: findings from the ENIGMA Epigenetics Working Group. Mol. Psychiatry 26, 3884–3895 (2021).
-
Šášik, R., Calvo, E. & Corbeil, J. Statistical analysis of high-density oligonucleotide arrays: a multiplicative noise model. Bioinformatics 18, 1633–1640 (2002).
-
Consortium, I. H. Integrating common and rare genetic variation in diverse human populations. Nature 467, 52 (2010).
-
Demontis, D. et al. Discovery of the first genome-wide significant risk loci for attention deficit/hyperactivity disorder. Nat. Genet. 51, 63–75 (2019).
-
Consortium, G. P. An integrated map of genetic variation from 1,092 human genomes. Nature 491, 56 (2012).
-
Hemani, G. et al. The MR-Base platform supports systematic causal inference across the human phenome. eLife 7, e34408 (2018).
-
Hannon, E., Lunnon, K., Schalkwyk, L. & Mill, J. Interindividual methylomic variation across blood, cortex, and cerebellum: implications for epigenetic studies of neurological and neuropsychiatric phenotypes. Epigenetics 10, 1024–1032 (2015).
-
Watanabe, K., Taskesen, E., Van Bochoven, A. & Posthuma, D. Functional mapping and annotation of genetic associations with FUMA. Nat. Commun. 8, 1826 (2017).
-
Giambartolomei, C. et al. Bayesian test for colocalisation between pairs of genetic association studies using summary statistics. PLoS Genet. 10, e1004383 (2014).
-
Sullivan, P. adhd2019. figshare https://doi.org/10.6084/m9.figshare.14671965 (2021).
-
Sullivan, P. adhd2022. figshare https://doi.org/10.6084/m9.figshare.22564390 (2023).
-
Sullivan, P. asd2019. figshare https://doi.org/10.6084/m9.figshare.14671989 (2021).
-
Sullivan, P. bip2021. figshare https://doi.org/10.6084/m9.figshare.14102594 (2025).
-
Sullivan, P. bip2024. figshare https://doi.org/10.6084/m9.figshare.27216117 (2025).
-
Sullivan, P. scz2022. figshare https://doi.org/10.6084/m9.figshare.19426775 (2025).
-
Hawe, J. S. et al. Genetic variation influencing DNA methylation provides new insights into the molecular pathways regulating genomic function—selected supplementary tables. Zenodo https://zenodo.org/record/5196216#.YRZ3TfJxeUk (2021).
Acknowledgements
This work received support from the following sources: the National Natural Science Foundation of China (number 82304241 to X.L.), the General Projects of Shanghai Science and Technology Commission (21ZR1405000 to X.L.), the European Union-funded FP6 Integrated Project IMAGEN (Reinforcement-related behavior in normal brain function and psychopathology; LSHM-CT- 2007-037286 to G.S.), the Horizon 2020-funded ERC Advanced Grant ‘STRATIFY’ (Brain network based stratification of reinforcement-related disorders; 695313 to G.S.), Horizon Europe ‘environMENTAL’ (101057429 to G.S.), UK Research and Innovation Horizon Europe funding guarantee (10041392 and 10038599 to S.D.), Human Brain Project (HBP SGA 2, 785907, and HBP SGA 3, 945539, to G.S.), the Chinese government via the Ministry of Science and Technology (MOST), the German Center for Mental Health (DZPG), the Bundesministerium für Bildung und Forschung (BMBF grants 01GS08152 and 01EV0711, Forschungsnetz AERIAL 01EE1406A and 01EE1406B, and Forschungsnetz IMAC-Mind 01GL1745B), the Deutsche Forschungsgemeinschaft (DFG project numbers 458317126 (COPE) to G.S., 186318919 (FOR 1617), 178833530 (SFB 940), 386691645 (NE 1383/14-1), 402170461 (TRR 265) and 454245598 (IRTG 2773)), the Medical Research Foundation and Medical Research Council (grants MR/R00465X/1 and MR/S020306/1) (to S.D.), the NIH-funded ENIGMA grants 5U54EB020403-05, 1R56AG058854-01 and U54 EB020403, NIH R01DA049238, the NIH, Science Foundation Ireland (16/ERCD/3797) (to A.L.W.B. and R.W.), and NSFC grant 82150710554 (to G.S.). Further support was provided by grants from the ANR (ANR-12-SAMA-0004 and AAPG2019 – GeBra to J.-L.M.), the Eranet Neuron (AF12-NEUR0008-01 – WM2NA and ANR-18-NEUR00002-01 – ADORe to J.-L.M.), the Fondation de France (00081242), the Fondation pour la Recherche Médicale (DPA20140629802 to J.-L.M.), the Mission Interministérielle de Lutte-contre-les-Drogues-et-les-Conduites-Addictives (MILDECA), the Assistance-Publique-Hôpitaux-de-Paris and INSERM (interface grant to J.-L.M.), Paris-Sud University IDEX 2012 (to J.-L.M.), the Fondation de l’Avenir (grant AP-RM-17-013 to J.-L.M.) and the Fédération pour la Recherche sur le Cerveau (grants DPA20140629802 and ADOLIMIS DPP20151033945 to J.-L.M.). For the purposes of open access, the author has applied a Creative Commons Attribution (CC BY) license to any Accepted Author Manuscript version arising from this submission.
Ethics declarations
Competing interests
T.B. served in an advisory or consultancy role for eye level, Infectopharm, Medice, Neurim Pharmaceuticals, Oberberg GmbH and Takeda. He received conference support or speakers fees from Janssen-Cilag, Medice and Takeda. He received royalties from Hogrefe, Kohlhammer, CIP Medien and Oxford University Press. L.P. served in an advisory or consultancy role for Roche and Viforpharm and received speakers fees from Shire. She received royalties from Hogrefe, Kohlhammer and Schattauer. The present work is unrelated to the above grants and relationships. The other authors declare no competing interests.
Peer review
Peer review information
Nature Mental Health thanks Jacob Bergstedt, Güneş Can and Kazutaka Ohi for their contribution to the peer review of this work.
Additional information
Publisher’s note Springer Nature remains neutral with regard to jurisdictional claims in published maps and institutional affiliations.
Supplementary information
Rights and permissions
Open Access This article is licensed under a Creative Commons Attribution 4.0 International License, which permits use, sharing, adaptation, distribution and reproduction in any medium or format, as long as you give appropriate credit to the original author(s) and the source, provide a link to the Creative Commons licence, and indicate if changes were made. The images or other third party material in this article are included in the article’s Creative Commons licence, unless indicated otherwise in a credit line to the material. If material is not included in the article’s Creative Commons licence and your intended use is not permitted by statutory regulation or exceeds the permitted use, you will need to obtain permission directly from the copyright holder. To view a copy of this licence, visit http://creativecommons.org/licenses/by/4.0/.
About this article

Cite this article
Qian, L., Shi, R., Yu, X. et al. Adolescent multi-omics and Mendelian randomization reveal transdiagnostic molecular mechanisms in psychiatric disorders. Nat. Mental Health (2026). https://doi.org/10.1038/s44220-026-00660-2
-
Received:
-
Accepted:
-
Published:
-
Version of record:
-
DOI: https://doi.org/10.1038/s44220-026-00660-2
Leave a Reply