
⏱ 29 min read
Main
Climate change is a critical global public health issue, with impacts extending beyond environmental changes, affecting human health, behavior and societal systems in complex ways1,2,3,4. Notably, rising global temperatures and increasing extreme weather events have been linked to various adverse health outcomes, including mental health disorders3,4,5,6,7. Epidemiological studies consistently highlight the negative effects of climate change on mental health, showing associations with post-traumatic stress disorder8,9, anxiety8,9,10, depression10, sleep disorders11 and suicide3,4,5,6.
Among the mental health-related challenges, suicide remains one of the leading causes of death globally, claiming an estimated 720,000 lives annually12. Climate change has emerged as an important contributor to the existing suicide burden13. High temperatures can exacerbate poor mental health outcomes through insomnia, increased stress levels and psychological instability, all of which contribute to suicide risk3,4,5,14,15,16. Numerous studies have identified a positive association between ambient temperature and suicide, suggesting that higher temperatures increase suicide risk17,18,19,20. The largest-scale multi-city multi-country study demonstrated that higher ambient temperatures generally increased suicide risks with regional variations in the degree and shape of the association20. Nonlinear inverse J-shaped relationships have been reported in East Asian countries such as Japan, the Republic of Korea and Taiwan, where suicide risk tends to decrease at extremely high temperatures after reaching a peak. By contrast, nearly linear patterns appeared in Western countries such as Canada, Spain, Switzerland, the UK and the USA, where suicide risk continued to increase with higher temperatures. Meanwhile, in the Philippines, Brazil, Vietnam and South Africa, the nonlinear curves were unclear or showed large uncertainty20.
Projections of climate-sensitive health responses are essential for anticipating future public health challenges owing to climate change and informing policy. Several studies have predicted the impacts of climate change on human health including morbidity and mortality across diverse countries21,22,23,24,25,26,27,28,29. Projections of temperature-related excess mortality under various climate change scenarios reveal regional disparities, with warmer and low-resource regions expected to bear a greater burden26. Under high-emission scenarios such as representative concentration pathway 8.5 (RCP8.5), which assumes continued high greenhouse gas emissions, warmer regions, including Central and South America, South Europe and particularly Southeast Asia, exhibit sharp increases in heat-related excess mortality (that is, mortality attributable to temperatures above the minimum mortality temperature), which outweigh reductions in cold-related excess mortality (that is, mortality attributable to temperatures below the minimum mortality temperature)26,27. Consequently, the net change in temperature-related excess mortality is projected to rise substantially in these regions. By contrast, temperate regions such as North Europe, East Asia and Australia, where warming is less intense, show smaller net increases in temperature-related excess mortality, primarily owing to pronounced declines in cold-related mortality26,27. These findings underscore the importance of policies to mitigate global warming and the disproportionate health risks faced by populations living in warmer and, in some cases, poorer regions.
Despite the importance of projection studies, few have assessed the impact of projected climate change on suicide burden30,31,32. One study using the high-emission scenario RCP8.5 estimated that a 1 °C monthly average temperature increase would cause a 0.7% rise in suicide rates in US counties and 2.1% rise in Mexican municipalities, potentially resulting in 9,000–40,000 additional suicides up to the year 205030. A more recent study in Japan projected temperature-related suicide mortality to rise under all climate scenarios31. In the 2090s, the projected increases compared with the 2010s were estimated under different shared socioeconomic pathway (SSP) scenarios, 0.6% for SSP1-2.6, 1.3% for SSP2-4.5 and 2.4% for SSP5-8.5, with greater increases under more extreme scenarios. In China, a nationwide case–control study identified a clear positive association between ambient temperature and suicide mortality, estimating that around 15% of suicide deaths were linked to non-optimum temperatures. The study further projected that excess suicide mortality would continue to rise throughout this century under high-emission scenarios, while stabilizing under moderate- and low-emission scenarios32. However, because most studies are country specific, a global comparative analysis is needed to elucidate the future global suicide burden under climate change.
This study aimed to (1) determine the extent of the temperature–suicide association based on observed data, (2) combine these associations with future temperatures under a changing climate and (3) predict future suicide mortality burden associated with temperatures across 751 locations in 26 countries by the 2050s (2050–2059). This work seeks to identify regional variations in the impacts of climate change on suicide risk and inform the development of effective suicide prevention and public health strategies.
Results
Table 1 summarizes the descriptive statistics of suicide and temperature for each of the 26 countries (based on data from 751 locations) as well as the suicide rate obtained from WHO Global Health Estimates33. The Republic of Korea, Japan, South Africa and Estonia reported high suicide rates of >20/100,000 population, whereas countries such as the Philippines, Mexico, Brazil and Paraguay recorded <5/100,000 population. The total number of suicides in the Multi-Country Multi-City (MCC) dataset was largely contributed by Japan and the Republic of Korea owing to long time coverage and high suicide rate. Average temperatures were relatively high in Southeast Asia (from 24 °C in Taiwan to 28.5 °C in Vietnam), South America (15.4 °C in Chile to 23.9 °C in Brazil) and Central America (18.8 °C in Mexico to 22.7 °C in Costa Rica). By contrast, North Europe recorded much lower average temperatures (3.8 °C in Finland to 10.5 °C in the UK). The average gross domestic product (GDP) for the countries in Central America, South America, Southeast Asia and South Africa was lower than that for other regions. The spatial distribution of mean temperatures across the 751 locations during the observation period is shown in Supplementary Fig. 1.
Table 2 shows the regional averages of modeled temperatures during the 2010s (2010–2019) and projected increases for the 2050s (2050–2059) for each SSP scenario. During the baseline period (2010s), Southeast Asia recorded the highest average temperature of 27.3 °C while North Europe had the lowest at about 5.3 °C. Across all three climate scenarios, North America was projected to show the largest temperature increase (1.25 °C to 2.43 °C), followed by North Europe (1.3 °C to 2.32 °C). By contrast, Southeast Asia (0.75 °C to 1.53 °C) and Australia (0.7 °C to 1.56 °C) were projected to exhibit the smallest rises. Under SSP2-4.5, all regions were projected to experience increases exceeding 1 °C relative to the baseline. Under the highest-emission scenario (SSP5-8.5), North America, North Europe, Central Europe and East Asia saw temperature increases exceeding 2 °C. Supplementary Fig. 2 presents the temporal changes in daily mean temperature relative to the average temperature during the 2010s, showing gradual warming under SSP1-2.6 and steep increases under SSP5-8.5 across all regions.
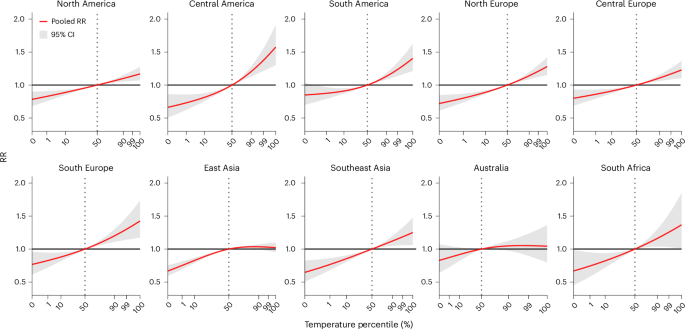
Figure 1 presents the overall cumulative temperature–suicide relationship by region, showing the relative risk (RR) across temperatures compared with the reference temperature (50th percentile of observed temperature) (see Methods for further details on the choice of reference temperature). The shape of the association varied across regions from linear to nonlinear. In North America, North Europe, Central Europe, South Europe, Southeast Asia and South Africa, the RR increased almost linearly with rising temperatures. Meanwhile, Central America and South America exhibited a J-shaped increase in RR as temperature increased. By contrast, East Asia and Australia demonstrated an inverse J-shaped nonlinear relationship, where RR increased with rising temperatures up to a threshold and then plateaued or slightly declined. Regions with many locations, such as North America, North Europe and East Asia (Table 1), exhibited narrower empirical confidence intervals (eCIs), indicating lower statistical uncertainty, than the other regions. The overall cumulative temperature–suicide relationships by country exhibited similar patterns within the same region, closely resembling the corresponding region-specific association curves (Supplementary Fig. 3).
The red line represents the pooled RR of suicide mortality across the temperature distribution, estimated from a two-stage meta-regression pooling location-specific exposure–response associations (n = 751 locations as independent observational units across 10 regions and 26 countries). The measure of center and shaded area show the pooled RR estimates and their corresponding 95% CIs. The dotted vertical line indicates the reference temperature (50th percentile of the regional temperature distribution), at which RR = 1.
Figure 2 presents the decadal changes in total attributable fraction (AF; %) of suicide mortality associated with temperatures relative to the 2010s (2010–2019) by region and SSP scenario (the corresponding numerical data are provided in Supplementary Table 1). The total AF represents the proportion of suicide mortality attributable to deviations from the reference temperature (as in Fig. 1) across the entire temperature range. Overall, total AF progressively increased over time and from the best-case (SSP1-2.6) to the worst-case (extreme-warming) scenario (SSP5-8.5), although the magnitude varied by region. In the 2050s (2050–2059), the numerical values of changes in total AF compared with the 2010s show that SSP1-2.6 projected a modest increase ranging from 0.6% in North Europe to 3.2% in Central America, while SSP2-4.5 projected from 0.9% to 4.4%. The largest increase is projected under SSP5-8.5, with projections ranging from 1.2% in North Europe to 6.4% in Central America (Fig. 2 and Supplementary Table 1). Similarly, the numerical projections for the decadal differences in the total attributable number (AN) of suicide deaths are provided in Supplementary Table 2.
The measure of center and error bars show the mean values (bars) and 95% eCIs (error bars) of the AF, derived from n = 1,000 Monte Carlo simulations across n = 5 GCMs. Gray circles show individual GCM-level estimates (n = 5 per bar). Regional estimates were aggregated from locations within each corresponding region (total n = 751 locations across 10 regions).
In warm climates, such as Central America, South America, Southeast Asia and South Africa, the total AF is projected to increase sharply (Fig. 2). For instance, in Central America under the SSP5-8.5 scenario, the increment in total AF was by 6.4% (3.8, 10.6) from the 2010s to the 2050s (Supplementary Table 1), associated with the J-shaped relationship presented by sharply increasing RR curve over temperatures in this region (Fig. 1). Meanwhile, temperate and colder regions, including North America, North Europe, Central Europe, South Europe, East Asia and Australia, showed smaller increases in total AF across the decades and scenarios compared with other regions. Specifically, in East Asia, the increase in total AF between 2010s and 2050s was minimal, 2% (1.2, 3.5), even under SSP5-8.5 (Fig. 2 and Supplementary Table 1), reflecting the inverse J-shaped relationship in which RR increases and then plateaus with rising temperatures (Fig. 1). At a finer spatial scale, Fig. 3 illustrates location-specific changes in the total AF across 751 locations under SSP5-8.5. These location-specific patterns were largely consistent with the regional-level results. Larger changes were generally observed in locations belonging to regions that exhibited greater increases in Fig. 2. Similar spatial patterns in total AF differences were also observed under SSP1-2.6 and SSP2-4.5 (Supplementary Fig. 4), although the absolute magnitudes of AF changes were smaller in the lower-emission scenarios.
Each point represents a study location and is colored according to the projected change in AF (%). Positive values indicate an increase in total AF in the 2050s relative to the 2010s. Map data © EuroGeographics, sourced via the giscoR 0.6.1 R package (CC BY 4.0).
Future suicide burden associated with climate warming was affected jointly by the magnitude of the temperature–suicide relationship and climate change-related temperature increase. Figure 4 shows these factors by region: (a) RRs at extreme temperatures (1st and 99th percentiles) compared with the 50th percentile; (b) temperature changes between the 2010s and 2050s under SSP5-8.5; and (c) the resulting changes in total AF of suicide mortality associated with temperatures between the 2010s and the 2050s under SSP5-8.5 for each region. The regions are ordered by the sum of the two RRs. The five regions exhibiting the largest increases in total AF—Central America, South Africa, South Europe, Southeast Asia and South America—are generally warmer. These regions are projected to show moderate temperature increases of about 1.5–2 °C and larger sums of RRs. By contrast, the remaining regions—North Europe, North America, Central Europe, East Asia and Australia—were colder or temperate, showing smaller increases in total AF mainly because of their smaller sums of the RRs. Supplementary Fig. 5 presents the results for SSP1-2.6 and SSP2-4.5, corresponding to those shown in Fig. 4 for SSP5-8.5. The regional patterns are generally consistent across scenarios, with only the absolute magnitudes. From SSP1-2.6 to SSP5-8.5, both temperature increases and total AF differences become progressively larger across regions.
a–c, RRs at extreme temperatures (1st and 99th percentiles (pct) compared with 50th percentile) with 95% eCIs (a); projected temperature changes from the 2010s to the 2050s under high-emission scenario (SSP5-8.5) (b); and changes in total AF (%) of suicide mortality associated with temperatures (%) for the 2050s relative to 2010s under high-emission scenario (SSP5-8.5) (c). Regions are ordered by the difference in RR between the 99th and 1st temperature percentiles (ascending). In a, the measure of center and error bars show the pooled RR values at the 1st percentile (blue) and 99th percentile (red) of the regional temperature distribution and their corresponding 95% CIs, derived from a two-stage meta-regression pooling location-specific exposure–response associations (n = 751 locations as independent observational units across 10 regions and 26 countries). In b, points represent the mean projected temperature change (°C) between the 2010s and 2050s, averaged across n = 5 GCMs (from Table 2). In c, bars represent the mean difference in total temperature AF (%) of suicide mortality between the 2010s and 2050s, averaged across n = 5 GCMs. Regional estimates were aggregated from locations within each corresponding region (total n = 751 locations).
Discussion
This study provides the first large-scale multi-country projection of suicide mortality burden associated with climate warming based on daily time series data for temperature and suicide mortality from 751 locations in 26 countries. Applying an advanced statistical methodology, we estimated the relationship between ambient temperature and suicide mortality based on observed data, linked these associations to modeled temperature under three SSP scenarios (SSP1-2.6, SSP2-4.5 and SSP5-8.5), and projected the future change in suicide mortality associated with temperature. We observed increases in future temperature-related suicide mortality from the 2010s to the 2050s, especially under the most extreme scenario SSP5-8.5.
Our findings are consistent with previous research linking rising temperatures to increased suicide risk. For example, our results in North and Central America are consistent with the elevated suicide risks projected under rising temperatures in the USA and Mexico for high-emission scenarios (for example, RCP8.5)30. Similar to our findings in East Asia, a Japanese study identified an inverse J-shaped relationship between temperature and suicide risk, with projected increases in temperature-related suicide mortality across various climate scenarios31. Likewise, a nationwide study in China reported that suicide mortality increased with higher temperatures, projecting sustained increases in temperature-related suicide deaths under the high-emission scenario (SSP5-8.5)32. Although previous studies have largely focused on individual countries30,31,32, their results support our conclusion that, without substantial climate mitigation, temperature-related suicide mortality is likely to rise with warming climate across diverse regions. By providing a global perspective, our study highlights the important worldwide mental health impacts associated with climate change.
We observed regional variations in projection of suicide burden associated with climate change. In warmer regions, such as Central and South America, South Europe, Southeast Asia and South Africa, steep increases were projected by the 2050s in all climate change scenarios. Meanwhile, temperate and colder regions, including North America, North Europe, Central Europe, East Asia and Australia, showed a more gradual increase. These regional differences primarily stem from distinct temperature–suicide relationships and the magnitude of climate change-related temperature increases. Warmer regions exhibited steeper temperature–suicide association curves, indicating that climate change intensifies high-temperature-related suicide risk. By contrast, temperate and colder regions showed gradual association curves. Notably, East Asia and Australia demonstrated inverse J-shaped temperature–suicide relationships, where suicide risk increased with temperature up to a certain point and then plateaued or slightly declined at extreme heat levels. This pattern may reflect behavioral and physiological adaptation to high temperatures among populations regularly exposed to hot conditions (for example, greater use of cooling systems and modified daily activities)34.
Furthermore, the extrapolation range (that is, extent to which future temperatures fall outside the historical temperature range) of this temperature–suicide relationship was influenced by the magnitude of temperature increases. North America and North Europe, having the largest projected temperature increase, showed extensive extrapolation into high-temperature ranges, whereas East Asia and Australia, having a minimal increase, experienced relatively little. Therefore, as temperature distributions shift under climate change, the risks of exposure to low and high temperatures decrease and increase, respectively, while the magnitude of the shifts vary by region.
Another potential explanation for regional variations in future temperature-related suicide mortality may be differences in socioeconomic conditions. Except for South Europe, the warmer regions that showed sharp increases in suicide mortality associated with temperatures over time often overlapped with countries of relatively low socioeconomic status (based on average GDP; Table 1). By contrast, regions where suicide risk increased more gradually tended to comprise countries with higher average GDP. These findings suggest that the impact of climate change on suicide mortality may be mediated indirectly by regional disparities in economic stability and social infrastructure. Climate change can exacerbate existing inequalities, as vulnerable populations and low-income countries face greater economic instability35,36, escalating conflicts37,38,39 and declining agricultural productivity/food security40. Moreover, in regions with limited access to mental health care and underdeveloped infrastructure, the lack of timely intervention and support may heighten the burden on vulnerable populations36. Therefore, the link between rising temperatures and suicide mortality may reflect, at least in part, the indirect consequences of socioeconomic hardship amplified by climate change.
Our findings underscore the uneven regional distribution of climate change-related mental health risks, highlighting the complex interplay between temperature–suicide associations, climatic shifts and socioeconomic conditions. As global temperatures rise, more frequent and prolonged exposure to extreme heat may worsen mental health outcomes and exacerbate existing disparities. Therefore, considering the projected increases in suicide mortality associated with temperatures, urgent climate mitigation and targeted mental health interventions are necessary to reduce climate-driven public health burdens. Moreover, our findings highlight the importance of region-specific strategies in addressing mental health issues at the global level, considering the local climate conditions, socioeconomic factors, demographic structure and healthcare infrastructure.
The impact of temperature on suicide risk is mediated by a complex interplay of physiological and psychological mechanisms. While the exact pathways are not fully understood, several studies have suggested that rising temperatures exacerbate mental health conditions and stress levels1,2,33, both of which increase suicide risk. In neuropsychology, heat exposure has been associated with disruptions in regulation of serotonin41,42—a neurotransmitter critical for mood stabilization. Low serotonin levels have been linked to increased impulsivity and suicidal behavior43,44,45. In addition, exposure to high temperatures promotes activation of the hypothalamic–pituitary–adrenal axis, leading to elevated blood concentrations of adrenocorticotropic hormone46,47, which subsequently increases the levels of cortisol—a hormone essential for energy production in response to external stress48. Furthermore, higher nighttime temperatures can impair sleep quality and contribute to sleep disturbances49,50, in turn contributing to emotional dysregulation, cognitive impairment and an increased susceptibility to mental health disorders5,49,50, including anxiety, depression, aggression and impaired judgment, substantially increasing the risk of suicidal ideation and behaviors49,50,51,52. Collectively, these mechanisms suggest that the relationship between temperature and suicide is not merely correlational but rather a reflection of how heat exposure disrupts neurobiological and psychological processes, ultimately increasing individual vulnerability to suicidal behavior.
By applying a consistent methodology across diverse countries and regions, this study addresses the limitations of previous single-country/-region studies, offering a more comprehensive and nuanced perspective on the climate–suicide relationship. The two-stage analytical framework addresses the challenges posed by data sparsity in areas with low suicide rates/reports and incorporates hierarchical structures to enhance the precision of location-specific estimates. Moreover, by accounting for within-country heterogeneity and cross-national economic differences, the study improves the accuracy of projections by capturing both local and broader contextual factors. Our approach yielded robust and reliable estimates of future suicide burdens across a range of climate change scenarios, providing an empirical foundation for developing targeted climate adaptation and healthcare strategies that support equitable and effective public health responses.
Several limitations should be acknowledged in this study. To isolate the effects attributable solely to climate change, our projections relied on several simplifying assumptions. First, baseline suicide rates were assumed to remain constant over time, although suicide trends are influenced by evolving socioeconomic conditions, mental health services and prevention policies12. Second, the exposure–response relationship between temperature and suicide was assumed to remain unchanged, implicitly representing a no-adaptation scenario, whereas behavioral, technological and infrastructural adaptation to heat may modify temperature-related risks26. Third, population size and demographic structure were assumed to remain static, ignoring potential changes owing to population growth, aging and migration26,27. These assumptions also create a conceptual inconsistency with the use of SSP-based temperature projections, as SSP pathways inherently incorporate assumptions regarding future socioeconomic development, demographic change and adaptation, while our projections of temperature-related suicide burden assumed no changes in population structure and no adaptation. Because all these factors may substantially influence future suicide burdens in complex way, the current projected estimates should be interpreted as scenario-based approximations rather than precise predictions. Future studies should therefore incorporate demographic dynamics, temporal change in suicide trends and potential adaptation when projecting temperature-related suicide burden to produce more realistic estimates31,32.
Second, the second-stage meta-regression model has limitations in fully capturing heterogeneity at both the location and country levels. In this stage, only a limited set of meta-predictors—including regional indicators, country-level GDP and location-specific temperature—were incorporated. The model may have limited ability to reflect country-specific characteristics among countries within the same region that share similar temperature ranges. Consequently, the modeling framework may tend to integrate suicide risk curves across countries with broadly similar characteristics, potentially overlooking meaningful differences in temperature–suicide relationships across countries and locations.
A further limitation arises from representing thermal exposure using only daily mean temperature. Mean temperature smooths intra-day variability and may fail to capture extreme daytime heat or elevated nighttime temperatures, both of which may influence psychological stress, sleep quality and behavioral responses associated with suicide risk. Because climate change may differentially affect daytime and nighttime temperatures and increase the frequency and persistence of heat extremes, projections based solely on daily mean temperature may underestimate or mischaracterize the future burden of temperature-related suicide. Future studies may benefit from incorporating additional exposure metrics such as daily maximum and minimum temperature, heatwave indicators or composite thermal indices.
Finally, our study is subject to several limitations in data availability. Although our study is conducted on a multiple-countries scale, it still lacks full global coverage owing to data availability limitations, particularly in parts of the Middle East and several areas in Africa. In addition, the observed data primarily represent urban regions, even though suicide behavior may vary between urban and rural communities. Furthermore, Australia and South Africa represent a single country rather than the entire continent, although they are compared individually with other regions. It may not fully reflect regional and climate variations, potentially limiting the broader applicability of the findings. Lastly, the quality of suicide data varies substantially across countries12. Globally, suicide underreporting—driven by poor certification systems, social stigma and in some settings the illegality of suicidal behavior—is estimated at about 18%, exceeding 30% in low- and middle-income countries12,53. In addition, the projections were based on suicide count data rather than suicide rates. Because counts are not standardized by the population at risk, this approach may also limit comparability across regions with different population sizes and may obscure the influence of demographic changes such as population growth or aging. Future studies may benefit from incorporating population-standardized suicide rates and demographic projections to better disentangle climate-related risk changes from demographic influences.
This study offers important insights into how warming climates may affect regional mental health burden. Our findings suggest that, without focused climate mitigation efforts, temperature-related suicide mortality could increase substantially in the coming decades owing to rising temperatures, underscoring the urgent need for integrated public health strategies that combine climate action with mental health support. We recommend adopting proactive preventive measures such as expanding community-based mental health programs, strengthening healthcare infrastructure, raising public awareness and addressing climate-driven economic vulnerabilities globally. By aligning climate mitigation efforts with targeted mental health and socioeconomic strategies, we can collectively reduce the psychological impacts of climate change, support vulnerable populations and foster a more sustainable, cooperative and healthier future.
Methods
Observed temperature and suicide data
We collected data through the MCC Collaborative Research Network (http://mccstudy.lshtm.ac.uk/), which provides daily time series data of mean temperature and suicide mortality from 751 locations across 26 countries. Suicide cases were identified according to the International Statistical Classification of Diseases and Related Health Problems (ICD) using the codes X60-X84 (ICD-10) and E950-E958 (ICD-8 and ICD-9), which represent intentional self-poisoning and self-harm54,55,56. Detailed information on data collection is provided in Supplementary Section 1. The dataset covers 1 January 1971 to 31 December 2021, although the years of available data vary by country. The 26 countries were categorized into 10 regions based on geographical and climatic characteristics: North America, Central America, South America, North Europe, Central Europe, South Europe, East Asia, Southeast Asia, Australia and South Africa, with the latter two each representing a single-country region. Table 1 shows the countries included in each region along with their respective observed data periods. This broad geographic coverage provides valuable insights into the impact of climate change on suicide across different climatic zones. Table 1 shows the summary statistics of suicide mortality and temperature for each country. Supplementary Fig. 1 shows the average observed temperatures across 751 locations worldwide.
Modeled temperature and suicide data
We obtained modeled daily mean temperature data for 1971–2059 under three SSP scenarios within Phase 6 of the Coupled Model Intercomparison Project57,58. The projection periods are defined by decade, starting from the 2010s (2010–2019) and continuing through the 2050s (2050–2059). SSP1-2.6, SSP2-4.5 and SSP5-8.5 scenarios represent combined projections of future socioeconomic development and greenhouse gas emissions, ranging from mitigation (SSP1-2.6) to intermediate stabilization (SSP2-4.5) and high-emission (SSP5-8.5) scenarios57. These SSPs are widely used in climate impact assessments to capture varying degrees of future climate change. The Inter-Sectoral Impact Model Intercomparison Project (ISIMIP) framework59 provides modeled mean temperature estimates using five general circulation models (GCMs) for each SSP scenario, which are bias-adjusted and downscaled to a spatial resolution of 0.5° × 0.5° (ref. 60). The five GCMs from the ISIMIP database (https://www.isimip.org/)61 include the Geophysical Fluid Dynamics Laboratory Earth System Model Version 4 (GFDL-ESM4), Institut Pierre-Simon Laplace Climate Model 6A-Low Resolution (IPSL-CM6A-LR), Max Planck Institute Earth System Model 1.2-High Resolution (MPI-ESM1-2-HR), Meteorological Research Institute Earth System Model Version 2.0 (MRI-ESM2-0) and UK Earth System Model Version 1.0-LL (UKESM1-0-LL)61.
For each of the 751 locations, daily mean temperatures were modeled by linking the geographic coordinates of the centroid of each location to the corresponding grid cell in the dataset, using the five GCMs under each SSP scenario. To adjust for differences between the modeled and observed daily mean temperatures, the modeled temperature data were calibrated using additive and multiplicative correction factors to align the monthly mean and daily variability of modeled temperatures with those of the observed temperature data at each location62,63. Regions showing large median differences (>5 °C) between observed and modeled temperatures after adjustment underwent a secondary bias correction by aligning their future mean temperatures with the national mean. Country-specific root mean square errors, presented in Supplementary Table 3, indicate close alignment between the calibrated modeled and observed temperatures. Table 2 presents the summary statistics of the modeled temperature estimates during the 2010s and projected increase for the 2050s by region and SSP scenario.
Modeled daily suicide mortality were calculated by averaging the observed suicide data for each calendar day and repeating the daily averages in all years during the projection period (2010–2059), assuming no changes in population structure or suicide rate. Hence, the population and suicide rates from the observed data were used as the baseline.
Statistical analysis
To project temperature-related suicide burden, we applied a statistical modeling framework26,30,31,62,64. First, location-specific temperature–suicide associations were estimated based on the observed data using a two-stage approach. Second, the estimated associations were extrapolated to cover the range of the temperature distribution through 2059, and future increases in suicide mortality attributable to temperatures were calculated under three key assumptions: no adaptation, no change in population structure and no change in suicide rate. A detailed explanation is provided in Supplementary Section 2.
Estimation of location-specific temperature–suicide relationship
The temperature–suicide association for each location was estimated using a two-stage approach. First, a conditional Poisson regression model65 was fitted for each location according to a time-stratified case-crossover design66. The stratum was defined by the three-way interaction of calendar year, month and day of the week, controlling for time-varying confounders such as seasonality and long-term temporal trends. To account for the nonlinear and delayed relationship between temperature and suicide, a distributed lag nonlinear model67 was used with a bidimensional cross-basis spline function and up to 3-day lag. The choice of lag was selected based on previous epidemiological studies31,32, which indicate that suicide risk is primarily influenced by short-term temperature exposure—typically within 2–3 days—rather than by prolonged lag effects. A natural cubic spline was used for the exposure–response association with a single internal knot at the 50th percentile of the location-specific temperature distribution. For the lag–response association, a discrete parameterization was used to define the intervals for lags 0 and 1–3. These specifications were determined through a model selection procedure (Supplementary Section 2.1.1 and Supplementary Table 4) and sensitivity analyses20,31,32 (Supplementary Fig. 11). Once the model was fit, the cross-basis coefficients were reduced to cumulate the exposure–response associations over the lags, and the reduced coefficients, which represent the cumulative temperature–suicide association, were used as inputs hereafter.
Second, we applied a multivariate mixed-effects meta-regression to pool the location-specific overall cumulative associations68. Random effects were included to account for intercept variability at both the country and city levels, assuming a hierarchical structure where cities are nested within countries. Meta-predictors were included as fixed effects, such as region indicator, country-level GDP and location-specific variables including average temperature and daily mean temperature range during the observation period. These specifications were determined through a model selection procedure (Supplementary Section 2.1.2 and Supplementary Table 5). From the model, we derived the best linear unbiased predictions of the overall cumulative associations for each location, expressed as RR curves. This two-stage model improves location-specific estimates by leveraging information from locations with similar characteristics, particularly for low observed daily suicide counts68.
Projection of region-specific impact of climate change on suicide
The burden of suicide mortality associated with temperatures (that is, temperatures lower or higher than the median of observed temperatures) was projected to compare the impact of climate change on suicide across regions26,31,32,63,65. The projection assumed (1) no behavioral or physiological adaptation to temperature change, (2) no change in population structure and (3) no change in baseline suicide rates. These assumptions are consistent with standard approaches in climate-health impact projection studies and allow for isolation of the temperature-attributable component of future suicide burden (Supplementary Section 2.2.1). The projection was based on the location-specific temperature–suicide associations, reference temperatures, modeled temperature and modeled suicide data.
Next, a reference temperature needed to be chosen to calculate suicide mortality associated with temperatures. The reference temperature served as the baseline for suicide risk across all temperatures, with ANs or AFs calculated relative to this baseline. To ensure reasonable future projections, the reference temperature was selected within a range of temperatures expected to exist in the future, enabling consistent and meaningful comparisons of suicide risk across different time periods. In this study, the 50th percentile (median) of the observed temperature distribution at each location was selected as the reference, as it is likely to remain within the projected temperature range in the 2050s even under the most extreme scenario (SSP5-8.5). For example, in Fortaleza, Brazil, the lowest projected temperature in the 2050s under SSP5-8.5 is 27.6 °C, which coincides with its observed median temperature (27.6 °C), indicating that future temperatures are expected to begin at levels that historically correspond to the median temperature (Supplementary Table 6 and Supplementary Fig. 6).
We centered the RR curves at the reference temperature (as in Fig. 1), and overall cumulative risks associated with temperature based on observed data were calculated relative to this reference and extrapolated through 2059. The RRs were calculated for future days with temperatures above/below the reference. For each combination of SSPs and GCMs, based on these RRs, daily ANs were calculated for each day from 2010 to 2059 at each location for all combinations of GCMs and SSP scenarios. The location-specific ANs were then aggregated by region, SSP and decade, and averaged across GCMs. The region-specific decadal ANs were divided by the total number of suicide deaths in each region to obtain decadal AF of suicide mortality associated with temperatures26,31,32,62. Finally, the difference in AF for each decade (2020s–2050s) relative to the 2010s (as presented in Fig. 2) was calculated to assess changes in future suicide burden associated with climate warming.
To put it more concretely, we examined the temporal changes in AF (%) of suicide mortality associated with temperatures above and below the reference. Because the reference temperature corresponds to the median of observed temperature distribution, the total AF can be decomposed into contributions from temperatures below and above this reference. For this decomposition, daily ANs were separately aggregated for days with temperatures above and below the reference at each location and summed by region, SSP and decade. These aggregated values were then divided by the total number of suicide deaths in each region to obtain AFs for warm and cold temperatures, respectively. Accordingly, regional changes in total AF were decomposed into contributions from warm (above-reference) and cold (below-reference) temperatures (Supplementary Fig. 7). While the relative contributions varied by region and location, AFs associated with both warm and cold temperatures increased over time and more intense warming, especially SSP5-8.5. The increase in AF associated with warm temperatures reflects a rise in excess suicide mortality at higher-than-reference temperatures. By contrast, the rise in AF for cold temperatures results from a diminishing protective effect of lower-than-reference temperatures, reducing the contribution of these lower temperatures that would otherwise offset excess suicide mortality. The spatial distribution of these decomposed results for each location is shown in Supplementary Fig. 8 for warm temperatures (above the reference temperature) and Supplementary Fig. 9 for cold temperatures (below the reference temperature).
We quantified the uncertainty in future temperature-related suicide mortality using Monte Carlo simulations at the meta-regression-model level64 (Supplementary Section 2.2.2). Specifically, n = 1,000 sets of coefficients were sampled from a multivariate normal distribution defined by the pooled coefficients and their variance–covariance matrix obtained from the second-stage meta-regression model. For each simulation, daily ANs were recalculated and aggregated to derive the empirical distribution of regional AFs. The 2.5th and 97.5th percentiles of this distribution were used as the 95% eCIs. These eCIs accounted for the correlation among location-specific predictions and uncertainty associated with the spatialization of random effects in the meta-regression model. Uncertainty from different climate projections was additionally incorporated by combining temperature estimates from five GCMs under three SSP scenarios, ensuring that the final impact estimates reflect uncertainty across both exposure–response estimation and climate projections. This approach captures the uncertainty in multiple stages of the analysis and reduces the risk of underestimation, particularly in analyses involving small-area data and low heterogeneity64.
Using the minimum suicide temperature as reference temperature
We compared our results with those obtained using the reference temperature defined as the temperature corresponding to the lowest suicide risk—the minimum suicide temperature (MinST) in the exposure–response curve (Supplementary Fig. 10). To avoid bias from extreme outliers, the MinST was identified within the 1st to 99th percentile range of observed daily temperatures, which in practice corresponded to the 1st temperature percentile in most locations (top panel in Supplementary Fig. 10). The overall shapes of the temperature–suicide association curves were similar to those obtained using the median temperature as the reference (top panel in Supplementary Fig. 10 and Fig. 1); however, using the MinST as the reference resulted in wider CI for RR estimates at higher temperatures (top panel in Supplementary Fig. 10). Using the MinST as a reference, temporal changes in total AF across future decades remained largely consistent with those obtained using the median-temperature reference (bottom panel in Supplementary Fig. 10 and Fig. 2). Although the absolute values of total AF varied slightly depending on the choice of reference temperature, AF estimates based on the MinST reference exhibited wider uncertainty across regions. Overall, the minimal differences observed between the two reference settings support the robustness of the results and the appropriateness of using the median temperature as the reference in the main analyses.
Sensitivity analysis
To assess the robustness of our results, a sensitivity analysis was conducted, referring to previous projection studies20,31,32. Owing to data accessibility limitations, the sensitivity analysis was not performed remotely; instead, it was conducted using data from 426 locations included in this study. Since temperature can influence suicide risk over short-term periods and previous epidemiological studies31,32 have adopted a 3-day lag, we compared only 3-day and 6-day lag structures. Temporal variations in total AF were similar between the two settings, indicating robustness to lag selection (Supplementary Fig. 11).
Reporting summary
Further information on research design is available in the Nature Portfolio Reporting Summary linked to this article.
Data availability
Observed daily suicide mortality and temperature data used in this study were obtained through the Multi-Country Multi-City (MCC) Collaborative Research Network (https://mccstudy.lshtm.ac.uk/) under data-sharing agreements with national and regional data providers and cannot be made publicly available owing to privacy considerations related to suicide mortality records. Access to the MCC dataset may be granted for scientific purposes via a formal application to the MCC network. Detailed information on data collection by country is provided in Supplementary Information. Modeled daily mean temperature data are publicly available from the Inter-Sectoral Impact Model Intercomparison Project (ISIMIP) database (https://www.isimip.org/) for the five General Circulation Models (GFDL-ESM4, IPSL-CM6A-LR, MPI-ESM1-2-HR, MRI-ESM2-0 and UKESM1-0-LL) under three SSP scenarios (SSP1-2.6, SSP2-4.5 and SSP5-8.5) used in this study.
Code availability
All statistical analyses were performed in R (version 4.3.3; R Core Team, 2024). The following R packages were used: dlnm (version 2.4.7), gnm (version 1.1.5) and tsModel (version 0.6.1), with the base R splines package, for the first-stage distributed lag nonlinear models; mixmeta (version 1.2.0) and mvmeta (version 1.0.3) for the second-stage multivariate mixed-effects meta-regression; MASS (version 7.3.60.0.1) for Monte Carlo simulation; tidyr (version 1.3.1) and dplyr (version 1.1.4) for data processing. Figures were produced using ggplot2 (version 3.5.0), cowplot (version 1.1.3), patchwork (version 1.2.0), reshape2 (version 1.4.4) and gridExtra (version 2.3). World map boundaries were obtained via giscoR (version 0.6.1), sf (version 1.0.20), rmapshaper (version 0.5.0) and classInt (version 0.4.10). The R code scripts used for the main analyses, including the two-stage modeling framework, projection of attributable fractions and uncertainty quantification, are publicly available via GitHub at https://github.com/hye0-n0/temperature-suicide-projection. Note that the deposited code uses simulated placeholder data for illustrative purposes only, as the original observed data cannot be shared publicly owing to data-sharing agreements (‘Data availability’). Consequently, the outputs generated by the deposited code will differ from the results reported in this study. Additional analysis code is available from the corresponding authors upon reasonable request.
References
-
Watts, N. et al. Health and climate change: policy responses to protect public health. Lancet 386, 1861–1914 (2015).
-
Chevance, G. et al. Thinking health-related behaviors in a climate change context: a narrative review. Ann. Behav. Med. 57, 193–204 (2023).
-
McMichael, A. J., Woodruff, R. E. & Hales, S. Climate change and human health: present and future risks. Lancet 367, 859–869 (2006).
-
Berry, H. L., Bowen, K. & Kjellstrom, T. Climate change and mental health: a causal pathways framework. Int. J. Public Health 55, 123–132 (2010).
-
Mullins, J. T. & White, C. Temperature and mental health: evidence from the spectrum of mental health outcomes. J. Health Econ. 68, 102240 (2019).
-
Rataj, E., Kunzweiler, K. & Garthus-Niegel, S. Extreme weather events in developing countries and related injuries and mental health disorders—a systematic review. BMC Public Health 16, 1020 (2016).
-
Tong, M. et al. Heat-attributable hospitalisation costs in Sydney: current estimations and future projections in the context of climate change. Urban Clim. 40, 101028 (2021).
-
Galea, S. et al. Exposure to hurricane-related stressors and mental illness after Hurricane Katrina. Arch. Gen. Psychiatry 64, 1427–1434 (2007).
-
Massazza, A., Ardino, V. & Fioravanzo, R. E. Climate change, trauma and mental health in Italy: a scoping review. Eur. J. Psychotraumatol. 13, 1–16 (2022).
-
Ingle, H. E. & Mikulewicz, M. Mental health and climate change: tackling invisible injustice. Lancet 4, e128–e130 (2020).
-
Rifkin, D. I., Long, M. W. & Perry, M. J. Climate change and sleep: a systematic review of the literature and conceptual framework. Sleep Med. Rev. 42, 3–9 (2018).
-
Suicide Worldwide in 2021: Global Health Estimates (World Health Organization, 2021).
-
Protecting Health from Climate Change: Global Research Priorities (World Health Organization, 2009).
-
Liu, J., Varghese, B., Hansen, A. & Bi, P. Effects of high temperatures on poor mental health outcomes: a systematic review and meta-analysis. Eur. J. Public Health 31, ckab164 (2021).
-
Thompson, R. et al. Ambient temperature and mental health: a systematic review and meta-analysis. Lancet 7, e580–e589 (2023).
-
Baecker, L. et al. Impacts of extreme heat on mental health: systematic review and qualitative investigation of the underpinning mechanisms. J. Clim. Change Health 22, 100446 (2025).
-
Heo, S., Lee, W. & Bell, M. L. Suicide and associations with air pollution and ambient temperature: a systematic review and meta-analysis. Int. J. Environ. Res. Public Health 18, 7699 (2021).
-
Kim, S., Kim, Y. & Park, E. Association of ambient temperature with intentional self-harm and suicide death in Seoul: a case-crossover design with a distributed lag nonlinear model. Int. J. Biometeorol. 68, 2321–2331 (2024).
-
Min, H. et al. Ambient temperature, suicide, and urbanicity: a nationwide time-stratified case-crossover study in South Korea. PLoS ONE 20, e0337945 (2025).
-
Kim, Y. et al. Suicide and ambient temperature: a multi-country multi-city study. Environ. Health Perspect. 127, 117007 (2019).
-
Madaniyazi, L., Guo, Y., Yu, W. & Tong, S. Projecting future air pollution-related mortality under a changing climate: progress, uncertainties and research needs. Environ. Int. 75, 21–32 (2015).
-
Huber, V. et al. Temperature-related excess mortality in German cities at 2 °C and higher degrees of global warming. Environ. Res. 186, 109447 (2020).
-
Hanigan, I. C. & Chaston, T. B. Climate change, drought and rural suicide in New South Wales, Australia: future impact scenario projections to 2099. Int. J. Environ. Res. Public Health 19, 7855 (2022).
-
Liang, C. et al. Projecting the morbidity burden of mental and behavioral disorders associated with increasing humid heat in Shanghai. Nat. Ment. Health 3, 1532–1544 (2025).
-
Madaniyazi, L. et al. Seasonality of mortality under climate change: a multi-country projection study. Lancet 8, e86–e94 (2024).
-
Gasparrini, A. et al. Projections of temperature-related excess mortality under climate change scenarios. Lancet 1, e360–e367 (2017).
-
Masselot, P. et al. Estimating future heat-related and cold-related mortality under climate change, demographic and adaptation scenarios in 854 European cities. Nat. Med. 31, 1294–1302 (2025).
-
Martínez-Solanas, È et al. Projections of temperature-attributable mortality in Europe: a time series analysis of 147 contiguous regions in 16 countries. Lancet Planet. Health 5, e446–e454 (2021).
-
Lee, W. et al. Projections of excess mortality related to diurnal temperature range under climate change scenarios: a multi-country modelling study. Lancet 4, e512–e521 (2020).
-
Burke, M. et al. Higher temperatures increase suicide rates in the United States and Mexico. Nat. Clim. Change 8, 723–729 (2018).
-
Thawonmas, R., Hashizume, M. & Kim, Y. Projections of temperature-related suicide under climate change scenarios in Japan. Environ. Health Perspect. 131, 117012 (2023).
-
Zhou, Y. et al. Assessing the burden of suicide death associated with non-optimum temperature in a changing climate. JAMA Psychiatry 80, 488–497 (2023).
-
Global Health Estimates (World Health Organization, 2025); https://www.who.int/data/global-health-estimates
-
Wu, C.-F., Hsieh, Y.-F. & Ou, S.-J. Thermal adaptation methods of urban plaza users in Asia’s hot-humid regions: a Taiwan case study. Int. J. Environ. Res. Public Health 12, 13560–13586 (2015).
-
Barnes, M. C. et al. Understanding vulnerability to self-harm in times of economic hardship and austerity: a qualitative study. BMJ Open 6, e010131 (2016).
-
Sinyor, M. et al. The coming global economic downturn and suicide: a call to action. Nat. Ment. Health 1, 233–235 (2023).
-
Burke, M., Hsiang, S. M. & Miguel, E. Climate and conflict. Annu. Rev. Econ. 7, 577–617 (2015).
-
Hsiang, S. M., Burke, M. & Miguel, E. Quantifying the influence of climate on human conflict. Science 341, 1235367 (2013).
-
Extreme Heat Can Take a Toll on Mental Health (American Psychiatric Association, 2023); https://www.psychiatry.org/news-room/apa-blogs/extreme-heat-can-take-a-toll-on-mental-health
-
Kjellstrom, T. & McMichael, A. J. Climate change threats to population health and well-being: the imperative of protective solutions that will last. Glob. Health Action 6, 20816 (2013).
-
Lõhmus, M. Possible biological mechanisms linking mental health and heat—a contemplative review. Int. J. Environ. Res. Public Health 15, 1515 (2018).
-
Gao, J. et al. Ambient temperature, sunlight duration, and suicide: a systematic review and meta-analysis. Sci. Total Environ. 646, 1021–1029 (2019).
-
Mann, J. J. The serotonergic system in mood disorders and suicidal behaviour. Phil. Trans. R. Soc. B 368, 20120537 (2013).
-
Korpi, E. R. et al. Serotonin and 5-hydroxyindoleacetic acid in brains of suicide victims. Comparison in chronic schizophrenic patients with suicide as cause of death. Arch. Gen. Psychiatry 43, 594–600 (1986).
-
Placidi, G. P. et al. Aggressivity, suicide attempts, and depression: relationship to cerebrospinal fluid monoamine metabolite levels. Biol. Psychiatry 50, 783–791 (2001).
-
Popovska-Perčinić, F. et al. A moderate increase in ambient temperature influences the structure and hormonal secretion of adrenal glands in rats. Cell J. 22, 415–424 (2021).
-
Park, J. et al. A protective role of urban greenspace on the association between night-time heat and suicide in Seoul, South Korea. Environ. Res. Health 2, 13 (2024).
-
Coryell, W. & Schlesser, M. The dexamethasone suppression test and suicide prediction. Am. J. Psychiatry 158, 748–753 (2001).
-
Obradovich, N., Migliorini, R., Mednick, S. C. & Fowler, J. H. Nighttime temperature and human sleep loss in a changing climate. Sci. Adv. 3, e1601555 (2017).
-
Kovats, R. S. & Hajat, S. Heat stress and public health: a critical review. Annu. Rev. Public Health 29, 41–55 (2008).
-
Perlis, M. L. et al. Suicide and sleep: is it a bad thing to be awake when reason sleeps? Sleep Med. Rev. 29, 101–107 (2016).
-
Shah, A. et al. Suicide rates in five-year age-bands after the age of 60 years: the international landscape. Aging Ment. Health 20, 131–138 (2016).
-
Meda, N. et al. How many people die by suicide each year? Not 727,000: a systematic review and meta-analysis of suicide underreporting across 71 countries over 122 years. Front. Psychiatry 16, 1609580 (2025).
-
International Statistical Classification of Diseases and Related Health Problems, 8th Revision (World Health Organization, 1966).
-
International Statistical Classification of Diseases, 9th Revision, Basic Tabulation List with Alphabetic Index (World Health Organization, 1978); https://apps.who.int/iris/handle/10665/39473
-
International Statistical Classification of Diseases and Related Health Problems, 10th Revision (World Health Organization, 2016); https://icd.who.int/browse10/2016/en
-
Riahi, K. et al. The shared socioeconomic pathways and their energy, land use, and greenhouse gas emissions implications: an overview. Glob. Environ. Change 42, 153–168 (2017).
-
O’Neill, B. C. et al. The Scenario Model Intercomparison Project (ScenarioMIP) for CMIP6. Geosci. Model Dev. 9, 3461–3482 (2016).
-
Warszawski, L. et al. The Inter-Sectoral Impact Model Intercomparison Project (ISIMIP): project framework. Proc. Natl Acad. Sci. USA 111, 3228–3232 (2014).
-
Lange, S. Trend-preserving bias adjustment and statistical downscaling with ISIMIP3BASD (v1.0). Geosci. Model Dev. 12, 3055–3070 (2019).
-
Lange, S. & Büchner, M. ISIMIP3b bias-adjusted atmospheric climate input data (v1.1). ISIMIP https://doi.org/10.48364/ISIMIP.842396.1 (2021).
-
Vicedo-Cabrera, A. M., Sera, F. & Gasparrini, A. Hands-on tutorial on a modeling framework for projections of climate change impacts on health. Epidemiology 30, 321–329 (2019).
-
Hempel, S., Frieler, K., Warszawski, L., Schewe, J. & Piontek, F. A trend preserving bias correction—the ISI-MIP approach. Earth Syst. Dyn. 4, 219–236 (2013).
-
Masselot, P. & Gasparrini, A. Modelling extensions for multi-location studies in environmental epidemiology. Stat. Methods Med. Res. 34, 615–629 (2025).
-
Armstrong, B. G., Gasparrini, A. & Tobias, A. Conditional Poisson models: a flexible alternative to conditional logistic case cross-over analysis. BMC Med. Res. Methodol. 14, 122 (2014).
-
Lu, Y., Symons, J. M., Geyh, A. S. & Zeger, S. L. An approach to checking case-crossover analyses based on equivalence with time-series methods. Epidemiology 19, 169–175 (2008).
-
Gasparrini, A., Armstrong, B. & Kenward, M. G. Distributed lag non-linear models. Stat. Med. 29, 2224–2234 (2010).
-
Sera, F., Armstrong, B., Blangiardo, M. & Gasparrini, A. An extended mixed-effects framework for meta-analysis. Stat. Med. 38, 5429–5444 (2019).
Funding
H.R. and Y.C. were supported by grants from the National Research Foundation (NRF) of Korea funded by the Korea government (MSIT) (numbers RS-2022-NR068758 and RS-2026-25470287) and by the NRF Basic Science Research Program funded by the Ministry of Education (numbers 2019R1A6A1A10073887 and RS-2025-25397599). Y.K. was supported by the Japan Society for the Promotion of Science (JSPS) KAKENHI (number JP24K10701). V.H. was supported by a ‘Ramón y Cajal’ fellowship of the Spanish Ministry of Science and Innovation (RYC2022-036948-I), and the Wellcome project BREATHE (308914/Z/23/Z). A.G. is supported by the Wellcome project BREATHE (308914/Z/23/Z). J.K. and A.U. were supported by the Czech Science Foundation (number 25-17587S). The funders had no role in study design, data collection and analysis, decision to publish or preparation of the manuscript.
Ethics declarations
Competing interests
The authors declare no competing interests.
Peer review
Peer review information
Nature Mental Health thanks Brian O’Shea, Rainer Papsdorf, Michael Tong and the other, anonymous, reviewer(s) for their contribution to the peer review of this work. Peer reviewer reports are available.
Additional information
Publisher’s note Springer Nature remains neutral with regard to jurisdictional claims in published maps and institutional affiliations.
Supplementary information
Rights and permissions
Open Access This article is licensed under a Creative Commons Attribution-NonCommercial-NoDerivatives 4.0 International License, which permits any non-commercial use, sharing, distribution and reproduction in any medium or format, as long as you give appropriate credit to the original author(s) and the source, provide a link to the Creative Commons licence, and indicate if you modified the licensed material. You do not have permission under this licence to share adapted material derived from this article or parts of it. The images or other third party material in this article are included in the article’s Creative Commons licence, unless indicated otherwise in a credit line to the material. If material is not included in the article’s Creative Commons licence and your intended use is not permitted by statutory regulation or exceeds the permitted use, you will need to obtain permission directly from the copyright holder. To view a copy of this licence, visit http://creativecommons.org/licenses/by-nc-nd/4.0/.
About this article

Cite this article
Ro, H., Kim, Y., Hashizume, M. et al. Multi-country projections of temperature-related suicide mortality. Nat. Mental Health 4, 1130–1141 (2026). https://doi.org/10.1038/s44220-026-00674-w
-
Received:
-
Accepted:
-
Published:
-
Version of record:
-
Issue date:
-
DOI: https://doi.org/10.1038/s44220-026-00674-w
Leave a Reply