Main
Autism spectrum disorder (referred to as ‘autism’ hereafter) affects approximately 1% of children around the world1 and is characterized by difficulties with social communication and interaction, restricted and repetitive behaviors, and sensory atypicalities2. There is a need to better appreciate the neurobiological correlates of autistic traits in youth, which will help improve understanding of the condition and might aid potential clinical utility. Furthermore, there is a growing movement to characterize conditions such as autism along dimensions of function3,4,5,6,7,8.
There are numerous approaches to characterize the brain-based correlates of autism traits using functional magnetic resonance imaging (fMRI) connectivity data, in which measures of similarity of the blood-oxygen-level-dependent signal are computed between different regions of interest9. In particular, prediction-based studies—using functional connectivity data to predict a phenotype—have proved promising. For example, case–control studies have focused on classifying those with autism compared with neurotypical participants, showing that high prediction accuracy can be achieved on the basis of functional connectivity differences10,11,12,13,14,15,16,17,18,19. Another approach predicts continuous measures of a phenotype (a symptom scale or a behavioral test score)19,20,21,22. One method of dimensional prediction is connectome-based predictive modeling (CPM)23,24, which seeks to identify the functional connections most strongly predictive of a given phenotype. Groups using CPM in autism samples have identified brain correlates of clinician-rated autism symptoms25,26 and other traits, such as behavioral inhibition27, social responsiveness25,28 and attentional states29. Successful models tend to comprise distributed networks, spanning cortical, subcortical and cerebellar regions. In particular, association cortices tend to be important in successful predictions, especially when the phenotypes relate to attention25,29. In addition, the most successful CPM models, while complex, consistently tend to comprise edges from about 5–10% of the connectome. This perhaps points to an optimal number of edges that might be involved in mediating brain–behavior relationships in those with autism.
Nevertheless, which conditions yield the best predictive modeling performance is still largely understudied. Most studies have focused on resting-state fMRI, in which participants rest quietly in the scanner. However, in neurotypical participants, the importance of scanning condition (for example, ‘brain state’) is being recognized30,31,32,33 for prediction of various phenotypes, including intelligence34,35,36, attention37,38, working memory39,40, personality traits41, cognition and emotion scores42, as well as for emphasizing individual differences in connectivity patterns43. These studies suggest that predicting out-of-scanner phenotypes using connectivity measured during task performance tends to increase prediction accuracy, particularly when the task probes some aspect of the out-of-scanner item of interest (for example, memory tasks in the scanner tend to result in higher prediction of memory performance outside the scanner39).
In addition, there are a number of elegant studies showing that in-scanner attention tasks can be used to inform the neurobiological organization of autism44,45,46,47,48. There are also other brain imaging studies suggesting an overlap between the functional networks mediating attention deficit hyperactivity disorder (ADHD) and autism25,49. At a behavioral level, the co-occurrence of autism and ADHD symptoms has long been acknowledged50,51,52,53.
Motivated by the importance of tasks in assessing phenotypes, as well as the importance of attention in autism, here we consider brain-state-associated improvements in prediction performance in a sample of youth with autism and neurotypical participants. Using data from three different scanning conditions—a task requiring sustained attention, a task requiring selective social attention (SSA), and resting-state data—we applied CPM to probe brain–behavior relationships. Specifically, the gradual onset continuous performance task (gradCPT)37,54,55 tests the ability to sustain attention to constantly changing stimuli. The SSA task captures the ability to process dynamic, multimodal faces presented one by one within a complex visual scene. One of the best replicated eye-tracking biomarkers in autism56,57,58,59,60, the SSA is devoid of any narrative content or interpersonal interaction and was designed such that speech (SP) and eye contact (EC) were varied. The task design was constructed to determine the effect of each condition on prediction performance.
We hypothesized that consistent with the social features of autism, prediction performance of autistic traits would be highest in the SSA task and would increase with the presence of increased social cues. Specifically, we expected that the condition containing both eye contact and speech (EC+SP+) would yield the strongest prediction performance. We hypothesized that the next highest prediction performance would result from the sustained attention task, due to the restricted and repetitive behaviors observed in autism, and that both tasks would outperform resting-state data. To determine whether results were robust, we used three other datasets to determine whether successful models can generalize to external samples. One of the datasets was used to assess the model’s generalizability in predicting performance on an attention task; the other two datasets were used to assess prediction of other autistic features.
Results
Overview
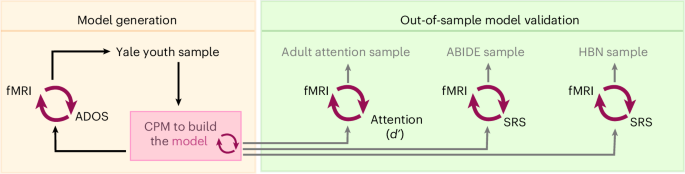
Four samples were used in this work (Fig. 1). The first dataset included 63 participants from a sample described previously (mean age = 11.7 years, s.d. = 2.8 years; 29 females; mean IQ = 107.8, s.d. = 15.1; Supplementary Table 1)29,61. Of these, 20 participants had autism; 11 other participants had a neurodevelopmental condition (5 had ADHD, 2 had anxiety disorder, and 4 were classified as belonging to the broader autism phenotype)62. Five of the participants with autism diagnoses had a co-occurring ADHD diagnosis; this was not significantly different compared with those without autism (X2 (1, N = 60) = 1.64 (Yates correction), P = 0.2001). Hereafter, we refer to this dataset as the ‘Yale youth sample’. It should be kept in mind that the sample comprised a mixture of those with autism and those without, and there were only 20 participants with an autism diagnosis. Autism symptoms were scored using the Autism Diagnostic Observation Schedule-2 (ADOS-2)63.

The Yale youth sample was the first dataset used. The fMRI connectivity data from different scanning conditions (task and rest) were used to generate connectome-based predictive models of ADOS scores (red circular arrows denote a brain–behavior predictive model). A summary predictive model was then generated and applied to the adult attention sample. The goal of this step was to determine whether the model generalized to predict attention phenotypes (d’) in an external dataset. The summary model was also applied to ABIDE and to HBN to determine whether the model predicted SRS scores in external samples.
Participants in the Yale youth sample completed three different scanning conditions (Fig. 2; see Methods for further description of each task). We note that the SSA clips were counterbalanced across participants; the other scan conditions were not (Supplementary Materials and Supplementary Fig. 1a). A standard preprocessing approach was used to generate connectomes34,64,65,66 from the different scanning conditions using a 268-node atlas67. For each participant, the mean time-course of each region of interest (‘node’) was computed, and the Pearson correlation coefficient was calculated between each pair of nodes to achieve a symmetric 268 × 268 matrix of correlation values representing connections between nodes (‘edges’). The Pearson correlation coefficients were then transformed to z scores via a Fisher transformation, and only the upper triangle of the matrix was considered, yielding 35,778 unique edges.

Top panel: free-viewing SSA task. Four conditions were shown to participants: no eye contact, no speech (EC–SP–); no eye contact, with speech (EC–SP+); eye contact, with no speech (EC+SP–); and eye contact, with speech (EC+SP+). No responses were required of participants during the different conditions. Middle panel: the gradCPT was used as a sustained attention task. Grayscale pictures of cities and mountains were presented, with images gradually transitioning from one to the next; button presses were required for city scenes and withheld for mountain scenes. Bottom panel: resting-state condition, in which the participants viewed a fixation cross. See Methods for further details about each scanning condition.
Prediction performance is highest in the Yale youth sample using task data
We first assessed which scanning condition resulted in the highest prediction performance of autistic traits in the Yale youth sample. To ensure consistent amounts of data across scanning conditions, we discarded frames from the end of gradCPT and resting-state runs, such that the total amount of data was the same as from the SSA task runs (4 minutes of data). CPM24 was then used to assess prediction performance of ADOS scores (Supplementary Fig. 1b) and was repeated 500 times. Head motion was controlled for during CPM as before29,68,69. The median-performing model is represented in the following text, along with prediction ranges where appropriate; significance was assessed via permutation testing (Methods).
We found differential performance across the various task conditions (Fig. 3 and Supplementary Table 2). For example, performance using the resting-state data was quite low (rest 1, Spearman’s rho = 0.093, P = 0.23; rest 2, Spearman’s rho = 0.18, P = 0.1240), and prediction performance was noted to have substantial variance (that is, using data from resting-state run 1, the minimum Spearman’s rho = –0.2017, maximum Spearman’s rho = 0.337, with 15% of the prediction performance scores below zero). Performance was also quite low in the SSA condition with no eye contact and no speech (EC–SP–; Spearman’s rho = -0.106, P = 0.822). Surprisingly, there was large variance in prediction performance scores using the SSA condition with eye contact and speech (EC+SP+; minimum Spearman’s rho = –0.172, maximum Spearman’s rho = 0.323, with 7.2% of the prediction performance scores below zero). Prediction performance was higher in the other SSA conditions but was not statistically significant after correcting for multiple comparisons (EC+SP–: Spearman’s rho = 0.251, P = 0.052; EC–SP+: Spearman’s rho = 0.266, P = 0.034). The only condition that resulted in statistically significant brain–behavior predictions was gradCPT 1 (Spearman’s rho = 0.441, P = 0.004, corrected). See Supplementary Table 2 for statistics for all CPM analyses.

The scan condition is shown on the x axis; on the y axis, Spearman’s rho is shown for the correlation of predicted and actual ADOS scores. For each condition, the median of the 500 iterations is shown as a solid black line in the violin plot, quartiles as dotted lines. The SSA task conditions are shown in purple, gradCPT in turquoise, and resting-state data in yellow. Statistical significance was obtained using permutation testing as described in Methods. Note that one-sided significance testing was used as we are interested in statistically significant positive predictions only. The asterisk (*) indicates statistical significance after correcting for multiple comparisons using the Benjamini–Hochberg method127 (correcting for ten tests: two for gradCPT, four for SSA, two for resting state, one for gradCPT average and one for resting-state average). Exact Spearman’s rho and P values for statistically significant conditions, gradCPT 1: Spearman’s rho = 0.441, P = 0.004; gradCPT average: Spearman’s rho = 0.445, P = 0.002.
Prediction performance has been noted to increase with increasing amounts of data70, possibly due to an increase in reliability of functional connectivity estimates71,72,73. We tested this possibility by combining data from gradCPT 1 and gradCPT 2, as well as resting-state session 1 and resting-state session 2. More data led to a slight increase in prediction performance using both gradCPT and rest (Fig. 3), although only gradCPT prediction performance was statistically significant after multiple comparisons correction (gradCPT average: Spearman’s rho = 0.445, P = 0.002, corrected; rest average: Spearman’s rho = 0.296, P = 0.038).
To ensure results were internally consistent, we repeated the CPM analysis using a multiverse approach, which assesses how results are affected by different analytical choices74. The point of this approach is not to determine what CPM pipeline results in the highest prediction performance. Instead, the goal is to assess various analytical scenarios and determine how arbitrary modeling choices impact CPM performance. In the Yale youth sample, we first adjusted CPM models for age, sex and IQ. Encouragingly, we found similar results to the preceding: gradCPT results in the highest prediction performance; the SSA task with no eye contact and no speech results in the lowest (Supplementary Table 2). The other SSA task conditions did not tend to result in high predictions; rest performance was also low. As an additional internal control, we assessed whether gradCPT task performance differed among those with autism compared with those without; we observed no difference in performance on the attention task (mean gradCPT score of participants with autism = 2.59 (s.d. 0.96); mean score of participants without autism = 2.66 (s.d. 0.86; (t(55) = −0.27, P = 0.79). Further, we conducted additional controls in which we modeled additional autistic traits with less skewed distributions than the ADOS scores used above; we again found successful prediction of ADOS uncalibrated scores, social responsiveness scale (SRS) scores and ADOS scores when balancing participants with and without autism (Supplementary Fig. 2 and Supplementary Table 3).
We continued with the multiverse analysis and repeated CPM using the same pipeline as above, except instead of predicting total ADOS scores, we attempted to predict the social affect and the restricted and repetitive behaviors subscales of the ADOS. We observed the same overall trend—gradCPT tends to result in the highest prediction performance, and the resting state and SSA task with no eye contact and no speech performed the poorest (Supplementary Fig. 1c and Supplementary Table 2). The SSA tasks resulted in increased prediction performance of social affect scores, but predictions were not significant after controlling for multiple comparisons. Prediction performance of restricted and repetitive behaviors using the SSA data tended to be low.
To ensure results were robust to preprocessing pipeline, we reprocessed functional data by altering the functional parcellation (using a 368-node instead of a 268-node atlas); we also repeated analyses without performing global signal regression. In both cases, we observed a similar pattern: gradCPT average had the best absolute prediction performance across pipelines tested, while the SSA and rest conditions tended to vary, with many prediction iterations below zero (Supplementary Fig. 1c and Supplementary Table 4). Interestingly, we observed, as have others34,75,76, that not performing global signal regression decreased the strength of brain–behavior relationships, while the overall prediction patterns across scans remained consistent. In summary, these results suggest that the CPM findings observed here were not being driven by a particular processing choice.
Finally, given that we are using a dimensional approach to predict ADOS scores, and ADOS scores are by definition higher in those with autism, we explored whether case versus control classification was possible. (Note there is no strict ADOS cut-off to classify autism—it is simply one component of a diagnostic evaluation—but scores tend to be >5 in those diagnosed.) Modifying CPM and balancing cases and controls, we observed gradCPT data resulted in the highest sensitivity, specificity and accuracy in case–control classification, particularly the gradCPT average data (Supplementary Fig. 1d and Supplementary Table 4). The fact that gradCPT afforded the highest predictions reiterates findings from the dimensional CPM—that task brain states requiring sustained attention tend to outperform those from the SSA and resting-state conditions.
External validation of predictive models
Attention prediction in the adult attention sample
Having determined that data derived from attention tasks are best for predicting autistic traits, we next assessed generalizability of the attention predictive model. Previously, we showed it is possible to build predictive models of sustained attention in the Yale youth sample and that such a model is related to autistic traits29. Therefore, we assessed the extent to which predictive models of autistic traits are related to sustained attention. To ensure generalizability was not driven by sample-specific noise, we tested the predictive model in an external dataset of individuals performing the same gradCPT task (n = 25 neurotypical adults, 13. of them female, mean age = 22.8 years, s.d. = 3.5 years)37. Hereafter, we refer to this dataset as the ‘adult attention sample’ (Fig. 1). The behavioral outcome of interest in this sample is performance on the gradCPT, d’ (sensitivity), the participant’s hit rate minus false alarm rate (mean d’ = 2.11, s.d. = 0.92).
We determined which edges tended to contribute consistently to successful prediction of ADOS phenotypes in the Yale youth sample (Methods, ‘Testing generalizability of the ADOS network’) using the model generated from average gradCPT data in the prediction of total ADOS scores. The resulting model (the ‘ADOS consensus network’) was used to determine whether there was a relationship between predicted ADOS scores and d’ scores in the adult attention sample. Specifically, we used the fMRI gradCPT task data from the adult attention sample to generate a predicted ADOS score. Predicted ADOS scores were then compared with actual d’ scores across participants to assess accuracy. This differs from the Yale youth sample, where we were able to compare predicted ADOS scores with observed ADOS scores. In the adult attention sample, the goal was to assess the relationship between the model (trained to predict ADOS) and attention (d’).
We observed a statistically significant relationship between predicted ADOS scores and d’ scores (Spearman’s rho = –0.56, P = 0.0049, corrected; Fig. 4a). Specifically, higher predicted ADOS scores were associated with lower d’ scores, indicating poorer performance on the task and implying lower sustained attention. To ensure results were robust, we repeated analyses controlling for potential confounds; predictions remained high when adjusting for participant head motion (Spearman’s rho = –0.56, P = 0.0043), participant sex (Spearman’s rho = –0.49, P = 0.0164) and participant age (Spearman’s rho = –0.55, P = 0.0066). In addition, we assessed the relationship between predicted ADOS scores and d’ scores using only the ADOS positive network and then only the ADOS negative network. We observed a statistically significant negative correlation in the ADOS positive model (Spearman’s rho = –0.59, P = 0.0021, corrected; Fig. 4b) and in the ADOS negative model (Spearman’s rho = –0.46, P = 0.023, corrected; Fig. 4c).

a, Results using the combined network model. b, Results using the positive-association network model. c, Results using the negative-association network model. Higher predicted ADOS scores are associated with lower d’ scores, indicating poorer performance on the task and implying lower sustained attention. Data are presented as a regression line (solid line) ± 95% confidence intervals (shaded areas). Spearman’s rho was calculated and was used to assess statistical significance (two-sided). The Benjamini–Hochberg method127 was used to correct for three tests.
Last, we altered the stringency of how often an edge had to be included in the ADOS consensus model (Methods). We observed consistent results across a range of thresholds (Supplementary Table 5), increasing confidence that there is a relationship between ADOS network strength and d’ scores. In summary, these results suggest that the predictive model of autistic traits captures variance related to sustained attention.
Social responsiveness prediction in ABIDE and HBN
After finding we could successfully predict attention scores, we set out to determine whether the predictive model from the Yale youth sample generalized to predict social responsiveness in a large sample of participants from the autism brain imaging data exchange (ABIDE; n = 229, 65 female participants; mean age = 10.45 years, s.d. = 1.8 years; mean IQ = 113.7, s.d. = 15.1; 77 individuals with autism)77,78 described elsewhere25. We used the same approach as in the adult attention sample to assess generalizability. Specifically, we used the resting-state data from ABIDE and applied the ADOS consensus model to predict SRS scores79 across participants (Methods). As with the preceding test of generalizability, predicted ADOS scores were then compared with actual SRS scores to assess accuracy.
We observed successful prediction of all SRS scales tested (Fig. 5). In particular, the model generalized to predict SRS total scores (Spearman’s rho = 0.17, P = 0.008, corrected; Fig. 5a) as well as SRS subscales quantifying communication (Spearman’s rho = 0.15, P = 0.028, corrected; Fig. 5b), mannerisms (Spearman’s rho = 0.21, P = 0.001, corrected; Fig. 5c) and motivation (Spearman’s rho = 0.16, P = 0.016, corrected; Fig. 5d). We also tested prediction of each SRS scale after adjusting for participant age, sex and head motion; predictions were essentially unchanged, further supporting that the ADOS model is capturing variance related to the SRS scales (Supplementary Table 6). As above, we altered how often an edge had to be included in the ADOS CPM and retested predictions. In every case, we observed similar predictions across various thresholds for all SRS scales (Supplementary Table 6).

a, SRS total score results. b, SRS communication score results. c, SRS mannerism score results. d, SRS motivation score results. Data are presented as a regression line (solid line) ± 95% confidence intervals (shaded areas). Spearman’s rho was calculated and was used to assess statistical significance (two-sided). The Benjamini–Hochberg method127 was used to correct for four tests.
We performed a similar test of generalization using data from the Healthy Brain Network (HBN; n = 643, 264 female participants; mean age = 11.01 years, s.d. = 2.63 years; mean IQ = 101.89, s.d. = 16.7; 107 participants had a diagnosis of autism; 302 had a diagnosis of ADHD). Using functional data obtained while participants watched a naturalistic movie clip (scenes from Despicable Me; Methods), we applied the ADOS consensus model to predict SRS Total T-scores (mean = 56.36, s.d. = 11.21)79 across participants. Predicted ADOS scores were then compared with actual SRS scores to assess accuracy. Controlling for head motion, we again observed the model generalized to predict SRS scores (Spearman’s rho = 0.1002, P = 0.0111). Like before, we tested a variety of summary models of differing sizes. We observed that results were stable when the consensus model had both more and fewer edges, supporting that our results were robust to model size (Supplementary Table 7). Taken together, these data indicate the ADOS model from the Yale youth sample generalized to predict aspects of sociality in ABIDE and HBN.
Neuroanatomy of predictive edges
We next visualized brain connections in the ADOS consensus model. The network comprised 2,014 total edges (1,001 edges in the positive-association network and 1,013 edges in the negative-association network), approximately 5.6% of the connectome, in line with other models that have generalized to predict autism and attention symptoms25,29. Edges across the brain were represented in the model, constituting a complex, distributed network (Fig. 6a,b). In particular, connections within and between heteromodal association networks were found to contain the highest fraction of edges (Fig. 6c,d; note that results have been corrected for differing network sizes)29. For example, the top three network pairs containing the greatest proportion of edges in the positive-association network involved the medial frontal, frontoparietal or default mode network. In the negative-association network, the top three network pairs involved connections within and between the medial frontal, frontoparietal or default mode network (for example, in this case, the top network pair comprised connections within the medial frontal network; the next highest network comprised connections between the medial frontal and frontoparietal networks; and the third highest network connected the medial frontal and default mode networks). In addition, 704 of 1,001 of the edges in the positive-association network and 535 of 1,013 of the edges in the negative-association network connected to the medial frontal, frontoparietal or default mode network. We performed further visualizations using slightly different thresholding techniques; these analyses again showed that association networks were important in the ADOS consensus model (Supplementary Fig. 1e).

a, The positive-association network. b, The negative-association network. For both a and b, a circle plot is shown in the upper left. The top of the circle represents anterior; the bottom represents posterior. The left half of the circle plot corresponds to the left hemisphere of the brain. A legend indicating the approximate anatomic ‘lobe’ is on the right. The same edges are plotted in the glass brains as lines connecting different nodes (red circles); in these visualizations, nodes are sized according to degree, the number of edges connected to that node. To aid in visualization, we have thresholded the matrices to show only nodes with a degree threshold > 25. c, Matrix of the positive-association network. d, Matrix of the negative-association network. For both c and d, the proportion of edges in a given network pair is shown; data have been corrected to account for differing network size. MF, medial frontal; FP, frontoparietal; DM, default mode; MT, motor; VI, visual I; VII, visual II; VA, visual association; CO, cingulo-opercular; SB, subcortical; CB, cerebellum.
Testing for convergence of task versus rest CPM findings
As a last test of generalizability, we repeated analyses, except we reversed the order of which dataset was used to build the original model. As our primary aim was determining whether task data outperformed resting-state data in the prediction of autistic traits, and ABIDE does not have task data, we used the HBN sample. Specifically, we used data from two conditions in which participants watched movies (Despicable Me and The Present) in the scanner, along with a resting-state condition. Although HBN does not contain the exact same tasks as the Yale youth sample, because the movie-watching conditions constitute a continuous task requiring sustained attention to an evolving narrative involving multiple characters interacting in a complex scene, the sample still allows us to test broadly whether there is a relationship between autistic traits and attention. Note that the naturalistic movies are distinct from the SSA tasks, which were designed to include only one actor speaking at a time in short phrases (that is, no narrative content or social interactions are otherwise presented by the participant during the SSA tasks).
After ensuring all scan conditions had the same amount of data per scan (Methods), we repeated CPM, controlling for participant head motion as above, and attempted to predict SRS scores. We observed successful prediction in the movie-watching conditions (median-performing model from Despicable Me: Spearman’s rho = 0.14, P < 0.001, corrected; median-performing model from The Present: Spearman’s rho = 0.11, P < 0.0001, corrected). Prediction using resting-state data was non-significant (median-performing model: Spearman’s rho = 0.05, P = 0.102, corrected (Supplementary Fig. 1f).
To assess generalizability of the model, we used connections that tended to contribute to successful predictions in the HBN Despicable Me condition to generate a consensus model (Methods). The resulting Despicable Me consensus model was used to assess whether there was a relationship between predicted SRS scores and ADOS scores in the Yale youth sample. Specifically, we used the gradCPT data in the Yale youth sample and applied the Despicable Me consensus model to predict SRS scores79 across participants (Methods), again controlling for head motion. Predicted SRS scores were then compared with actual ADOS scores to assess accuracy. Successful prediction was achieved (Spearman’s rho = 0.26; P = 0.0422). To ensure results were robust, we repeated analyses using different thresholds when generating the consensus mask; we found results were stable across both looser and stricter thresholds (Supplementary Table 8). In summary, the analyses in this section replicate our initial finding that task data outperform resting-state data in predicting autistic traits and that such a model can generalize in external samples.
Discussion
We determined that using functional connectivity calculated from data acquired during gradCPT resulted in the prediction of autistic traits. The resulting model generalized to independent samples to predict attention and social phenotypes in neurotypical participants and those with autism. Altogether, results highlight the potential of using in-scanner tasks, particularly those demanding sustained attention, to more accurately determine brain–behavior relationships in clinical samples.
There is a rich history of using tasks to probe the cognitive architecture of autism45,80,81,82,83,84. Nevertheless, most fMRI brain–behavior prediction studies in autism that use machine-learning techniques have typically relied on resting-state data (see ref. 4 for a recent review). Our results suggest that by optimizing the brain state under which data are acquired through task engagement85, more accurate brain–behavior relationships can be studied30. Improved brain–behavior mapping increases the potential clinical utility of neuroimaging approaches86 and might help obtain a more accurate picture of brain circuits underlying the complex phenotypic landscape of autism. Tasks also offer the advantage of improving the reliability of task-engaged functional connections87. More generally, the results obtained here are in line with other work in neurotypical populations, indicating that predictions of phenotypes improve when using task as opposed to resting-state data30,34,35,36,37,42,88. We note that resting-state studies still retain utility, particularly in terms of ease of data collection and their ability to facilitate the collation of large datasets across centers.
Despite tasks outperforming rest-based models, our data indicate that not all tasks are equal. Our original hypothesis regarding prediction performance was that reflective of social difficulties in autism, the SSA tasks would result in the highest prediction of ADOS scores. That an attention task—superficially unrelated to the core aspects of autism—outperformed a task designed to probe social abilities reinforces the importance of empirical work. The current results suggest that simply because a scanning condition is ostensibly related to a given phenotype does not mean that a brain–behavior relationship can be found in neurodevelopmental conditions.
It is perhaps puzzling that the SSA clips did not result in higher prediction performance. This could be due to the passive nature of the SSA clips, allowing the participants to let their minds wander56,57. As such, SSA clips could be interpreted as resembling the resting state89. The unconstrained nature of the resting state might be suboptimal for probing certain aspects of brain–behavior relationships30. In parallel, it is perhaps also surprising that the gradCPT data resulted in the highest prediction performance. Beyond attention, the highly structured, rules-based design of gradCPT may effectively highlight variations in networks linked to autistic traits given the rules-based tendencies observed in autism90.
Regardless of the exact mechanism, our finding that gradCPT led to the prediction of autistic and attention phenotypes adds to the growing literature suggesting an important link between autism and attention at the neurobiological level. Previous studies25,48,91,92 have indicated that complex models spanning numerous functional networks are important for attention in autism. In addition, the size of the ADOS consensus model is of interest (approximately 5% of the connectome) and is in line with the size of other models that have generalized to predict autism and attention symptoms25,29. Notably, these models tend to share a few characteristics with the ADOS consensus model. Edges tend to originate across the entire brain, linking within and between most canonical network pairs. This finding underscores that there is no one region or network preferentially involved in a given phenotype, consistent with other psychiatric conditions93. The fact that distributed brain connections mediate complex behaviors is a theme observed in multiple species, including the global brain dynamics underlying homeostatic sleep behaviors in Caenorhabditis elegans94, to long-range connections underpinning social decisions in primates95.
While the ADOS model is complex, post hoc analyses revealed other neurobiological trends. Similar to the ADOS model, previous models involved in predicting attention and autism all tend to have particular representation in heteromodal association cortices68, including the default mode (recently reviewed in ref. 96). In work involving CPM, the default mode network tends to be important, especially in the negative networks25,27,29. In CPM, edges composing the negative network are selected on the basis of a negative correlation with the behavior of interest. In this work, it follows that higher connectivity in the default mode, typically associated with more mind-wandering or internally directed states97, would be associated with lower attention abilities, as well as potentially higher autistic traits. (A recent mega-analysis has observed hyperconnectivity involving the default mode network in both autistic and ADHD participants98). It is plausible that interactions among association networks—including not only the default mode but also the medial frontal and frontal parietal networks—are needed to coordinate the complex cognitive demands associated with higher-level brain functions99, such as sustaining attention and picking up on social cues.
We contend that autistic traits and attentional abilities are hence multifaceted, interrelated processes. Because the CPM also predicts attention in the adult sample, it indicates that the attention task state is appropriately influencing brain circuits of interest involved in modulating attention in the Yale autism sample. That the CPM goes on to predict a different phenotype related to a core component of autism—namely, social difficulties—reiterates the shared relationships between autistic features and attention. Indeed, autism and ADHD symptoms have long been acknowledged to overlap50,51,52,100. In a more extreme example, it is possible the CPM is more related to a broader pathology and could be applicable, to some degree, to many other phenotypes, similar to the p-factor101. Instead of commenting on the validity of the p-factor as a single unifying construct102, we simply note that there are numerous examples of redundancy103 and degeneracy in biological circuits104,105, especially in brain networks. Further, we do not mean to argue that we have discovered a ‘core autism/attention network’. Rather, it is logical that these phenotypes, both defined to some extent by how complex information is perceived from the outside world, are associated with overlapping circuitry.
A few additional items warrant discussion in the final paragraphs. Participant IQ scores in the Yale youth sample and ABIDE were fairly high. More research should be conducted using participants with a broad range of IQ scores to determine which scanning conditions are optimal for prediction performance. The current work relied on a sample of 20 out of 63 participants with autism. Future work could aim to repeat analyses in more participants with autism. The autism dataset contained mainly male participants; the importance of sex-based differences in brain circuitry106,107,108 and behavioral phenotypes109 relevant for autism is increasingly well described. It is possible that a more active social task requiring participant engagement (unlike the SSA task) could increase prediction performance. Likewise, given the success of the movie-watching conditions of the HBN, perhaps more naturalistic movie clips (demanding the processing of narrative content and complex, interpersonal relationships) are another promising path forward in autism research110,111. Further, the role of arousal and its impact on predictive modeling could also be studied. In addition, while we have taken numerous steps to lessen the effect of head motion, it can still impact brain–behavior relationships; this must be kept in mind when interpreting the current work. A potential limitation of the adult attention sample is that it is composed of older participants; another possible interpretation is that it strengthens the generalizability of the CPM. That is, the fact the model generalized in a different age range eliminates the potential confound that the model is confounded by age in the Yale youth sample (which in turn would drive successful generalization in a test sample of similar ranges, but would fail to generalize in a sample comprising different ages).
In addition, this work focused on prediction of traits in an adolescent dataset that is relatively small; the adult attention sample was also quite small. Although replicable and generalizable findings can still be determined by using robust methods112,113,114 and we were well powered in the current study (see Methods for a power analysis), future studies in larger samples are needed. Collecting small, unique samples also facilitates testing across diverse experimental conditions, thereby enhancing generalizability115. We contend that in the age of big data, it is essential to continue exploring brain–behavior associations in samples that might not contain thousands of participants but include unique scanning conditions. Such an approach allows the field to better determine which scans to include in big data endeavors and facilitates the exploration of questions that may be difficult to address in large-scale studies. Balancing the need for large samples with adequate scans per participant is a key concern that has received much attention in the neurotypical brain-wide association literature116,117. Related studies could be pursued in the autism field. Including participants with moderate autism symptoms to tease apart the brain correlates of more subtle phenotypes will be an important aspect of future work, regardless of exact study design. More studies could also be conducted to assess task design and prediction performance in much younger samples, such as toddlers and young children. Such efforts aim to optimize the detection of brain–behavior relationships at earlier developmental stages, ultimately providing better support for individuals with autism and their families.
Conclusions
We have shown in a preliminary study that sustained attention tasks, such as gradCPT, can enhance the prediction of autistic traits. Such an approach leads to a robust marker that generalizes to predict attention and social phenotypes in independent samples. Our findings highlight the need to further investigate optimal brain states for modeling phenotypes in autism and related conditions.
Methods
Description of datasets
We used four datasets in this work (Fig. 1). The first dataset, the Yale youth sample, comprised 63 participants from a sample described elsewhere (mean age = 11.7 years, s.d. = 2.8 years; 29 female participants; mean IQ = 107.8, s.d. = 15.1)29,61. Of the 63 participants, 20 had autism (5 of whom had ADHD); 11 other participants had a neurodevelopmental condition (5 with ADHD, 2 with anxiety disorder, and 4 were classified as belonging to the broader autism phenotype)62. Participants were scanned on a 3T Siemens Prisma System. See Supplementary Information for full exclusion criteria and imaging parameters. Autism symptoms were scored using the ADOS-2 (ref. 63) and were ascertained by trained clinical psychologists; calibrated severity scores were used in this work for the social affect subscale (mean = 3.2, s.d. = 2.9), the restricted and repetitive behavior subscale (mean = 4.0, s.d. 3.3) and the ADOS total score (mean = 3.1, s.d. = 3.1). This sample was used to conduct CPM, compare how scanning condition impacted performance and generate a consensus model. Note that although the sample is small, we were well powered to detect effects. Using the R package ‘pwr’ with a sample size of 63 participants and assuming a significance level of 0.05 (two-sided), a correlation between predicted and observed ADOS scores in gradCPT average of 0.445 corresponds to a power of 0.96.
A second dataset of neurotypical adults, the adult attention sample (n = 25, 13 female participants, mean age = 22.8 years, s.d. = 3.5 years), was used as a validation dataset and is described elsewhere37. Participants were scanned on a 3T Siemens Trio TIM system. This sample was used to determine whether the consensus model generalized to predict attention.
A third dataset of individuals with and without autism (n = 229, 65 female participants; mean age = 10.45 years, s.d. = 1.8 years; mean IQ = 113.7, s.d. = 15.1) using data from ABIDE77,78 was used as an additional validation dataset; processing of these data is described elsewhere25. Note that 77 of 229 participants were diagnosed with autism. SRS79 raw scores were used from ABIDE and included the following scales: SRS Total scores (mean = 42.4, s.d. = 40.2); SRS communication (mean = 13.8, s.d. = 14.2); SRS motivation (mean = 7.3, s.d. = 6.9); and SRS mannerisms (mean = 7.1, s.d. = 8.5). Seventy-seven of the participants had autism. SRS was chosen due to the low number of participants with ADOS scores (when using the exclusion criteria described in ref. 25), along with the additional quality control exclusion criteria we performed (that is, there were 229 participants with SRS data compared with only 33 with ADOS; Supplementary Methods). This sample was used to determine whether the consensus model generalized to predict SRS scores.
A fourth dataset of individuals (n = 643, 264 female participants; mean age = 11.01 years, s.d. = 2.63 years; mean IQ = 101.89, s.d. = 16.7) using data from the transdiagnostic HBN sample118 was used as an additional validation dataset. In the current study, 107 had a diagnosis of autism, while 302 had a diagnosis of ADHD. Processing of these data is described elsewhere119. SRS79 Total T-scores were used from HBN (mean = 56.36, s.d. = 11.21). This sample was used to determine whether the consensus model generalized to predict SRS scores.
For the Yale youth sample and the adult attention sample, the Yale University institutional review board oversaw and approved the ethics of the study. For HBN, the study was approved by the Chesapeake Institutional Review Board. The data for ABIDE were approved by each of the 16 sites contributing data (that is, approval was required by each of the home institutions before submission)77. Where appropriate, informed consent was obtained from the parents or guardians of participants, and participants were paid for their involvement. Written assent was obtained from children aged 13–17 years; verbal assent was obtained from participants under the age of 13 years.
Preprocessing of functional imaging data
We used a standard preprocessing approach that has been described elsewhere34,64,65,66. Preprocessing steps were performed using BioImage Suite120 unless otherwise noted, and these included skull stripping the three-dimensional magnetization-prepared rapid gradient-echo images using optiBET121 and performing linear and nonlinear transformations to warp a 268-node functional atlas23 from Montreal Neurological Institute space to single participant space. Functional images were motion corrected using SPM8122. Covariates of no interest were regressed from the data, including linear, quadratic and cubic drift, a 24-parameter model of motion123, mean cerebrospinal fluid signal, mean white matter signal and the global signal. Data were temporally smoothed with a zero-mean unit-variance low-pass Gaussian filter (approximate cut-off frequency of 0.12 Hz). Visual inspections were performed after skull stripping, nonlinear and linear registrations to ensure there were no errors in processing. Head motion was computed as the mean frame-to-frame displacement (FFD) of the participant’s head61 (see Supplementary Methods for additional motion control considerations and Supplementary Fig. 1g). To ensure consistent amounts of data across scanning conditions, we discarded frames from the end of the gradCPT and resting-state runs such that the total amount of data was the same as from the SSA task runs (4 minutes of data).
Connectomes were generated using a 268-node atlas23. For each participant, the mean time-course of each region of interest (node) was computed, and the Pearson correlation coefficient was computed between each pair of nodes to achieve a symmetric 268 × 268 matrix of correlation values representing edges (connections between nodes). The Pearson correlation coefficients were then transformed to z scores via a Fisher transformation, and only the upper triangle of the matrix was considered, yielding 35,778 unique edges.
The 268-node atlas was chosen because it is a full-brain parcellation, covering cortical, subcortical and cerebellar regions, as well as striking a good balance in terms of number of nodes and reducing computational resources while approximating biologically plausible brain regions67. For example, the 268-node atlas results in 35,778 unique edges (because number of edges = ((number of nodes × number of nodes) – number of nodes)/2). Increasing the atlas size by 100 to 368 nodes results in 67,528 edges, almost doubling the number of edges and thereby doubling compute time. In addition, from a practical perspective, the 268-node parcellation allows generalization testing in the adult attention, ABIDE samples and HBN samples, which had previously been processed using the 268-node atlas25,29,37,119. To ensure results were not being driven by this specific parcellation, we repeated analyses using a 368-node atlas124 (which was generated using a different approach, namely, a spectral clustering algorithm in the cortex, anatomical labeling of structures in subcortical regions, and by incorporating cerebellar regions defined elsewhere125). We found CPM results did not differ, consistent with other brain–behavior modeling studies, showing that results tend to be stable across a range of parcellations34,75.
Scanning conditions in the Yale youth sample
Scanning condition one
Participants completed a version of a free-viewing SSA task56,59 in which an actor is presented at the center of the screen and is surrounded by objects in corners of the screen (Fig. 2). Four types of clips were used in which the presence of speech (SP) and eye contact (EC) were manipulated. The first condition included clips in which the person smiled and made eye contact with the camera while speaking in full sentences (for example, “Have you ever seen a monkey? Monkeys eat bananas, swing in trees and chase each other.”; this was designated as the EC+SP+ condition). The second condition included a direct gaze condition with no speech (EC+SP–), in which the person smiled directly at the viewer while remaining silent. The third condition consisted of the person looking down at the table while speaking in full sentences (EC–SP+). The fourth condition consisted of the person looking down at the table and not speaking (EC–SP–). Each clip lasted 2 minutes and was shown twice over four runs, such that eight clips were shown in total. To allow successful scene transitions between sentences, the direct gaze and speech condition lasted 2 minutes 8 seconds. The speech with no eye contact condition lasted 2 minutes 6 seconds. Between clips during each run, a white fixation cross on a black background was shown for 15 seconds. Clip order was counterbalanced across participants (see Supplementary Information for more about the counterbalancing of clips as well as study design considerations of the Yale youth sample). Clip conditions were concatenated across runs such that each resulting connectivity matrix contained 4 minutes of data from a single scanning condition. Both gradCPT and the SSA task were presented using Psychtoolbox (version 3.0.14; http://psychtoolbox.org/; MATLAB version R2018a) on a Lenovo IdeaPad 720S computer with Ubuntu 16.04 LTS installed.
Scanning condition two
The gradCPT (Fig. 2)37,54,55 was used in datasets one and two. The gradCPT tests sustained attention and inhibition, producing a range of performance scores across neurotypical54,55 and neurodiverse populations29. Participants viewed grayscale pictures of cities and mountains presented at the center of the screen, with images gradually transitioning from one to the next every 1,000 ms. Participants were instructed to respond with a button press for city scenes and to withhold button presses for mountain scenes. City scenes occurred randomly 90% of the time. Performance was calculated using d’ (sensitivity), the participant’s hit rate minus false alarm rate. The task took 5 minutes to complete; participants completed the task twice. Note that because of differences in task timing between gradCPT, the selective social attention task and resting state, we trimmed the gradCPT and resting-state data to include 4 minutes of data per scan (to match the selective social task time of 4 minutes).
Participants in the adult attention sample also performed gradCPT; the same parameters were used, except scene transitions took 800 ms.
Scanning condition three
Resting-state data were also obtained. Participants were instructed to keep their eyes open, relax and think of nothing in particular while they viewed a white fixation cross on a black screen. Each scan lasted 5 minutes and was repeated twice per participant. Resting-state data were also obtained in the ABIDE sample77,78.
Scanning conditions in the HBN sample
We considered three conditions when performing CPM. Specifically, we used functional data from two separate naturalistic movie conditions, in which participants watched Despicable Me and The Present, as well as a single run of resting-state data. Because of differences in scan time across conditions, we truncated time courses so they were consistent across all three conditions, so that all matrices were generated using 4 minutes of data (the length of The Present).
Connectome-based predictive modeling
CPM24 (Supplementary Fig. 1b) was used to predict ADOS scores from functional connectivity data in the Yale youth sample. Briefly, using tenfold cross-validation, connectivity matrices from a given scan condition and ADOS scores were split into an independent training set including participants from nine folds and a test set including the left-out fold. Linear regression was used to relate edge strength to ADOS score in the training set. Edges most strongly associated with ADOS scores were selected (feature selection threshold of P = 0.05) for both a ‘positive network’ (in which increased connectivity was associated with higher ADOS scores) and a ‘negative network’ (in which increased connectivity was associated with lower ADOS scores). We used partial correlation to control for mean participant head motion at the feature selection step29,68,69. Note that this is the ‘base model’ we are considering throughout the results (that is, the results shown in Fig. 3 used partial correlation to control for motion). Mean network strength was computed in both the positive and negative networks, and the difference between these network strengths was computed (‘combined network strength’), as in previous work34.
A linear model was then calculated relating combined network strength to ADOS scores in the training set. In the last step, combined network strength was computed for the test set, and the model was applied to generate ADOS predictions for these unseen participants.
Model performance was assessed69 by comparing the similarity between predicted and observed ADOS scores using Spearman’s correlation (to avoid distribution assumptions)126. Note that performance was assessed on the entire sample after cross-validation. That is, in a given iteration, each of the ten folds resulted in a set of predictions for ADOS. After each participant had a predicted score from being in the test set, Spearman’s correlation was used to assess the relationships between predicted and observed scores across the entire sample. We performed 500 iterations of a given CPM analysis and selected the median-performing model; we report this in the main text when discussing model performance. To calculate significance, we randomly shuffled participant labels and attempted to predict ADOS scores. We repeated this 500 times and calculated the number of times a permuted predictive accuracy was greater than the median of the unpermuted predictions to achieve a non-parametric P value:
$$P=(#({{rm{rho}}}_{{rm{null}}}ge {{rm{rho}}}_{{rm{median}}}))/500$$
where #(rhonull ≥ rhomedian) indicates the number of permuted predictions numerically greater than or equal to the median of the unpermuted predictions69. We used the Benjamini–Hochberg method127 to correct for multiple comparisons, correcting for ten tests in the Yale youth sample (two for gradCPT, four for SSA, two for resting state, one for gradCPT average and one for resting-state average), three tests in the adult attention sample and four tests in ABIDE.
We note the same CPM approach was used in the HBN sample, except fivefold cross-validation was used, in line with the larger sample size126. All other parameters were the same as above. We corrected for three tests in the HBN sample when correcting for multiple comparisons.
Testing generalizability of the ADOS network
To determine whether the ADOS networks from the Yale youth sample generalized to external datasets (the adult attention sample, ABIDE and HBN), we defined a consensus positive-association network and a consensus negative-association network as edges that appear in at least 6 of 10 folds in 300 of 500 iterations of CPM. This process resulted in 1,001 edges in the positive-association network and 1,013 edges in the negative-association network; hereafter, we refer to the collection of edges in the positive and negative networks as the ‘ADOS consensus network.’ We note the size of the ADOS consensus network is consistent with other CPM networks that have generalized37,128,129. To ensure generalizability results were robust, we tested summary networks of varying sizes (from liberal cases where an edge appeared in at least 1 of 10 folds and 50 of 500 iterations, to more stringent thresholds where an edge must appear in 10 of 10 folds and 500 of 500 iterations, moving in intervals of 1 fold and 50 iterations for each summary network).
To determine whether the network predicted autistic traits, we then used the combined network strength in the ADOS consensus network and computed model coefficients across the Yale youth sample37,68,75. Model coefficients and the network masks were subsequently applied to the ABIDE and HBN samples to predict SRS scores. Model performance was determined by comparing the similarity between predicted and observed behavioral scores using Spearman’s correlation. We used the same approach to determine whether the network predicted d’ scores.
To further assess generalizability, we repeated testing whether the ADOS network predicts d’ and SRS using a multiverse approach. A multiverse analysis assesses how results are affected by different analytical choices74. Specifically, we tested whether the ADOS positive and negative networks generalized; we adjusted models for IQ, age and sex; and, as mentioned, we tested a range of consensus network sizes. We point out the goal of a multiverse approach is not to determine what pipeline results in the highest prediction performance. Instead, the point is to assess various analytical scenarios and determine how different modeling choices impact generalization. As such, we do not perform multiple comparisons correction when assessing these results.
For completeness, we include the additional multiverse analyses performed in the Yale youth sample in this section. In this dataset, we adjusted CPM models for sex, age and IQ; we also used CPM to predict social affect and restricted and repetitive behavior scores. In addition, we assessed how altering the feature selection threshold impacted CPM.
Testing generalizability of the SRS network from HBN
After determining that Despicable Me was the highest-performing condition for SRS prediction, we reperformed CPM using the full 10 minutes of data from the functional scans (recall that comparing how scan condition affected CPM performance forced us to truncate all scans to 4 minutes of data). After performing 500 iterations of CPM predicting SRS scores in HBN as before (median Spearman’s rho = 0.1398; P = 0.006), we generated a consensus network similar to above. Specifically, we required an edge to appear in at least 3 of 5 folds in 300 of 500 iterations of CPM. This process resulted in 940 edges in the positive-association network and 893 edges in the negative-association network. To ensure generalizability results were robust, we again tested summary networks of varying sizes (from liberal cases where an edge appeared in at least 1 of 5 folds and 50 of 500 iterations, to more stringent thresholds where an edge must appear in 5 of 5 folds and 450 of 500 iterations, moving in intervals of 1 fold and 50 iterations for each summary network). The resulting summary networks were then applied to the Yale youth sample to determine whether the model generalized to predict ADOS scores using the gradCPT average data.
Reporting summary
Further information on research design is available in the Nature Portfolio Reporting Summary linked to this article.
Data availability
The functional parcellation is available here at https://www.nitrc.org/frs/?group_id=51. ABIDE data are available here at https://fcon_1000.projects.nitrc.org/indi/abide/. HBN data are available here at https://fcon_1000.projects.nitrc.org/indi/cmi_healthy_brain_network/. To protect the sensitive nature of data in the adult attention and Yale youth sample, please reach out to the corresponding authors for questions about, or access to, these samples.
Code availability
Preprocessing was carried out using freely available software from BioImage Suite Web 1.2.0 (https://medicine.yale.edu/bioimaging/suite/; current build: 1.2.0, 2020/08/25, 11:43:02). Template scripts that were used for preprocessing of the functional data, as well as CPM code, are available at https://github.com/clhorien/tasks_versus_rest_in_autism_prediction/tree/main. CPM analyses were conducted in MATLAB (R2021b).
References
-
Zeidan, J. et al. Global prevalence of autism: a systematic review update. Autism Res. 15, 778–790 (2022).
-
Diagnostic and Statistical Manual of Mental Disorders: DSM-5 (American Psychiatric Association, 2013).
-
Feczko, E. & Fair, D. A. Methods and challenges for assessing heterogeneity. Biol. Psychiatry 88, 9–17 (2020).
-
Horien, C. et al. Functional connectome-based predictive modeling in autism. Biol. Psychiatry https://doi.org/10.1016/j.biopsych.2022.04.008 (2022).
-
Insel, T. et al. Research domain criteria (RDoC): toward a new classification framework for research on mental disorders. Am. J. Psychiatry 167, 748–751 (2010).
-
Duan, X., Shan, X., Uddin, L. Q. & Chen, H. The future of disentangling the heterogeneity of autism with neuroimaging studies. Biol. Psychiatry https://doi.org/10.1016/j.biopsych.2024.08.008 (2024).
-
Park, S. et al. Delineating a pathway for the discovery of functional connectome biomarkers of autism. Adv. Neurobiol. 40, 511–544 (2024).
-
Tang, S. et al. Reconciling Dimensional and Categorical Models of Autism Heterogeneity: a brain connectomics and behavioral study. Biol. Psychiatry 87, 1071–1082 (2020).
-
Biswal, B., Yetkin, F. Z., Haughton, V. M. & Hyde, J. S. Functional connectivity in the motor cortex of resting human brain using echo-planar MRI. Magn. Reson. Med. 34, 537–541 (1995).
-
Anderson, J. S. et al. Functional connectivity magnetic resonance imaging classification of autism. Brain 134, 3742–3754 (2011).
-
Chen, C. P. et al. Diagnostic classification of intrinsic functional connectivity highlights somatosensory, default mode, and visual regions in autism. Neuroimage Clin. 8, 238–245 (2015).
-
Guo, X. Y. et al. Diagnosing autism spectrum disorder from brain resting-state functional connectivity patterns using a deep neural network with a novel feature selection method. Front. Neurosci. 11, 460 (2017).
-
Iidaka, T. Resting state functional magnetic resonance imaging and neural network classified autism and control. Cortex 63, 55–67 (2015).
-
Jahedi, A., Nasamran, C. A., Faires, B., Fan, J. & Muller, R. A. Distributed intrinsic functional connectivity patterns predict diagnostic status in large autism cohort. Brain Connect. 7, 515–525 (2017).
-
Abraham, A. et al. Deriving reproducible biomarkers from multi-site resting-state data: an autism-based example. Neuroimage 147, 736–745 (2017).
-
Emerson, R. W. et al. Functional neuroimaging of high-risk 6-month-old infants predicts a diagnosis of autism at 24 months of age. Sci. Transl. Med. 9, eaag2882 (2017).
-
Chen, H. et al. Multivariate classification of autism spectrum disorder using frequency-specific resting-state functional connectivity—a multi-center study. Prog. Neuropsychopharmacol. Biol. Psychiatry 64, 1–9 (2016).
-
Uddin, L. Q. et al. Salience network-based classification and prediction of symptom severity in children with autism. JAMA Psychiatry 70, 869–879 (2013).
-
Yahata, N. et al. A small number of abnormal brain connections predicts adult autism spectrum disorder. Nat. Commun. 7, 11254 (2016).
-
Hong, S. J. et al. Atypical functional connectome hierarchy in autism. Nat. Commun. 10, 1022 (2019).
-
Ilioska, I. et al. Connectome-wide mega-analysis reveals robust patterns of atypical functional connectivity in autism. Biol. Psychiatry 94, 29–39 (2023).
-
Xiao, J. et al. Linked social-communication dimensions and connectivity in functional brain networks in autism spectrum disorder. Cereb. Cortex 31, 3899–3910 (2021).
-
Finn, E. S. et al. Functional connectome fingerprinting: identifying individuals using patterns of brain connectivity. Nat. Neurosci. 18, 1664–1671 (2015).
-
Shen, X. L. et al. Using connectome-based predictive modeling to predict individual behavior from brain connectivity. Nat. Protoc. 12, 506–518 (2017).
-
Lake, E. M. R. et al. The functional brain organization of an individual allows prediction of measures of social abilities transdiagnostically in autism and attention-deficit/hyperactivity disorder. Biol. Psychiatry 86, 315–326 (2019).
-
Ma, X. et al. Connectome-based prediction of the severity of autism spectrum disorder. Psychoradiology 3, kkad027 (2023).
-
Rohr, C. S., Kamal, S. & Bray, S. Building functional connectivity neuromarkers of behavioral self-regulation across children with and without autism spectrum disorder. Dev. Cogn. Neurosci. 41, 100747 (2020).
-
Dufford, A., Kimble, V., Tejavibulya, L., Dadashkarimi, J. & Scheinost, D. Predicting transdiagnostic social impairments in childhood using connectome-based predictive modeling. Biol. Psychiatry 91, S87 (2022).
-
Horien, C. et al. A generalizable connectome-based marker of in-scan sustained attention in neurodiverse youth. Cereb. Cortex 33, 6320–6334 (2023).
-
Finn, E. S. Is it time to put rest to rest? Trends Cogn. Sci. 25, 1021–1032 (2021).
-
O’Connor, D., Horien, C., Mandino, F. & Constable, R. T. Identifying dynamic reproducible brain states using a predictive modelling approach. Imaging Neurosci. (Camb.) https://doi.org/10.1162/imag_a_00540 (2025).
-
Zhang, X., Hulvershorn, L. A., Constable, R. T., Zhao, Y. & Wang, S. Cost efficiency of fMRI studies using resting-state vs task-based functional connectivity. Hum. Brain Mapp. https://doi.org/10.1002/hbm.70260 (2025).
-
Ramduny, J. & Kelly, C. Connectome-based fingerprinting: reproducibility, precision, and behavioral prediction. Neuropsychopharmacology 50, 114–123 (2024).
-
Greene, A. S., Gao, S. Y., Scheinost, D. & Constable, R. T. Task-induced brain state manipulation improves prediction of individual traits. Nat. Commun. 9, 2807 (2018).
-
Jiang, R. T. et al. Task-induced brain connectivity promotes the detection of individual differences in brain-behavior relationships. Neuroimage 207, 116370 (2020).
-
Greene, A. S., Gao, S., Noble, S., Scheinost, D. & Constable, R. T. How tasks change whole-brain functional organization to reveal brain–phenotype relationships. Cell Rep. 32, 108066 (2020).
-
Rosenberg, M. D. et al. A neuromarker of sustained attention from whole-brain functional connectivity. Nat. Neurosci. 19, 165–171 (2016).
-
Yoo, K. et al. A brain-based general measure of attention. Nat. Hum. Behav. 6, 782–795 (2022).
-
Ju, S. et al. Connectome-based predictive modeling shows sex differences in brain-based predictors of memory performance. Front. Dement. 2, 1126016 (2023).
-
Avery, E. W. et al. Distributed patterns of functional connectivity predict working memory performance in novel healthy and memory-impaired individuals. J. Cogn. Neurosci. 32, 241–255 (2020).
-
Hardikar, S. et al. Personality traits vary in their association with brain activity across situations. Commun. Biol. 7, 1498 (2024).
-
Finn, E. S. & Bandettini, P. A. Movie-watching outperforms rest for functional connectivity-based prediction of behavior. Neuroimage 235, 117963 (2021).
-
Finn, E. S. et al. Can brain state be manipulated to emphasize individual differences in functional connectivity? Neuroimage 160, 140–151 (2017).
-
Keehn, B., Nair, A., Lincoln, A. J., Townsend, J. & Muller, R. A. Under-reactive but easily distracted: an fMRI investigation of attentional capture in autism spectrum disorder. Dev. Cogn. Neurosci. 17, 46–56 (2016).
-
Keehn, B., Shih, P., Brenner, L. A., Townsend, J. & Muller, R. A. Functional connectivity for an “Island of sparing” in autism spectrum disorder: an fMRI study of visual search. Hum. Brain Mapp. 34, 2524–2537 (2013).
-
Vaidya, C. J. et al. Controlling attention to gaze and arrows in childhood: an fMRI study of typical development and autism spectrum disorders. Dev. Sci. 14, 911–924 (2011).
-
Rahko, J. S. et al. Attention and working memory in adolescents with autism spectrum disorder: a functional MRI study. Child Psychiatry Hum. Dev. 47, 503–517 (2016).
-
Fitzgerald, J. et al. Disrupted functional connectivity in dorsal and ventral attention networks during attention orienting in autism spectrum disorders. Autism Res. 8, 136–152 (2015).
-
Kernbach, J. M. et al. Shared endo-phenotypes of default mode dsfunction in attention deficit/hyperactivity disorder and autism spectrum disorder. Transl. Psychiatry 8, 133 (2018).
-
Stevens, T., Peng, L. & Barnard-Brak, L. The comorbidity of ADHD in children diagnosed with autism spectrum disorder. Res. Autism Spectr. Disord. 31, 11–18 (2016).
-
Reiersen, A. M. & Todd, R. D. Co-occurrence of ADHD and autism spectrum disorders: phenomenology and treatment. Expert Rev. Neurother. 8, 657–669 (2008).
-
Antshel, K. M. & Russo, N. Autism spectrum disorders and ADHD: overlapping phenomenology, diagnostic issues, and treatment considerations. Curr. Psychiatry Rep. 21, 34 (2019).
-
Alvarez-Fernandez, S. et al. Perceived social support in adults with autism spectrum disorder and attention-deficit/hyperactivity disorder. Autism Res. 10, 866–877 (2017).
-
Esterman, M., Noonan, S. K., Rosenberg, M. & DeGutis, J. In the zone or zoning out? Tracking behavioral and neural fluctuations during sustained attention. Cereb. Cortex 23, 2712–2723 (2013).
-
Rosenberg, M., Noonan, S., DeGutis, J. & Esterman, M. Sustaining visual attention in the face of distraction: a novel gradual-onset continuous performance task. Atten. Percept. Psychophys. 75, 426–439 (2013).
-
Chawarska, K., Macari, S. & Shic, F. Context modulates attention to social scenes in toddlers with autism. J. Child Psychol. Psychiatry 53, 903–913 (2012).
-
Chawarska, K., Macari, S. & Shic, F. Decreased spontaneous attention to social scenes in 6-month-old infants later diagnosed with autism spectrum disorders. Biol. Psychiatry 74, 195–203 (2013).
-
Shic, F., Macari, S. & Chawarska, K. Speech disturbs face scanning in 6-month-old infants who develop autism spectrum disorder. Biol. Psychiatry 75, 231–237 (2014).
-
Shic, F., Wang, Q., Macari, S. L. & Chawarska, K. The role of limited salience of speech in selective attention to faces in toddlers with autism spectrum disorders. J. Child Psychol. Psychiatry 61, 459–469 (2020).
-
Campbell, D. J., Shic, F., Macari, S. & Chawarska, K. Gaze response to dyadic bids at 2 years related to outcomes at 3 years in autism spectrum disorders: a subtyping analysis. J. Autism Dev. Disord. 44, 431–442 (2014).
-
Horien, C. et al. Low-motion fMRI data can be obtained in pediatric participants undergoing a 60-minute scan protocol. Sci. Rep. 10, 21855 (2020).
-
Ingersoll, B. Broader autism phenotype and nonverbal sensitivity: evidence for an association in the general population. J. Autism Dev. Disord. 40, 590–598 (2010).
-
Lord, C. et al. Autism Diagnostic Observation Schedule 2nd edn (Western Psychological Services, 2012).
-
Greene, A. S. et al. Brain–phenotype models fail for individuals who defy sample stereotypes. Nature 609, 109–118 (2022).
-
Horien, C. et al. Considering factors affecting the connectome-based identification process: comment on Waller et al. Neuroimage 169, 172–175 (2018).
-
Rapuano, K. M. et al. Behavioral and brain signatures of substance use vulnerability in childhood. Dev. Cogn. Neurosci. 46, 100878 (2020).
-
Shen, X., Tokoglu, F., Papademetris, X. & Constable, R. T. Groupwise whole-brain parcellation from resting-state fMRI data for network node identification. Neuroimage 82, 403–415 (2013).
-
Dufford, A. J. et al. Predicting transdiagnostic social impairments in childhood using connectome-based predictive modeling. Preprint at medRxiv https://doi.org/10.1101/2022.04.07.22273518 (2022).
-
Scheinost, D. et al. Functional connectivity during frustration: a preliminary study of predictive modeling of irritability in youth. Neuropsychopharmacology 46, 1300–1306 (2021).
-
Taxali, A., Angstadt, M., Rutherford, S. & Sripada, C. Boost in test–retest reliability in resting state fMRI with predictive modeling. Cereb. Cortex 31, 2822–2833 (2021).
-
Birn, R. M. et al. The effect of scan length on the reliability of resting-state fMRI connectivity estimates. Neuroimage 83, 550–558 (2013).
-
Laumann, T. O. et al. Functional system and areal organization of a highly sampled individual human brain. Neuron 87, 657–670 (2015).
-
Noble, S. et al. Influences on the test–retest reliability of functional connectivity MRI and its relationship with behavioral utility. Cereb. Cortex 27, 5415–5429 (2017).
-
Steegen, S., Tuerlinckx, F., Gelman, A. & Vanpaemel, W. Increasing transparency through a multiverse analysis. Perspect. Psychol. Sci. 11, 702–712 (2016).
-
Ju, Y. et al. Connectome-based models can predict early symptom improvement in major depressive disorder. J. Affect. Disord. 273, 442–452 (2020).
-
Li, J. et al. Global signal regression strengthens association between resting-state functional connectivity and behavior. Neuroimage 196, 126–141 (2019).
-
Di Martino, A. et al. Data descriptor: enhancing studies of the connectome in autism using the autism brain imaging data exchange II. Sci. Data 4, 170010 (2017).
-
Di Martino, A. et al. The autism brain imaging data exchange: towards a large-scale evaluation of the intrinsic brain architecture in autism. Mol. Psychiatry 19, 659–667 (2014).
-
Constantino, J. N. et al. Validation of a brief quantitative measure of autistic traits: comparison of the social responsiveness scale with the autism diagnostic interview—revised. J. Autism Dev. Disord. 33, 427–433 (2003).
-
Koshino, H. et al. Functional connectivity in an fMRI working memory task in high-functioning autism. Neuroimage 24, 810–821 (2005).
-
McGrath, J. et al. Atypical visuospatial processing in autism: insights from functional connectivity analysis. Autism Res. 5, 314–330 (2012).
-
Gilbert, S. J., Bird, G., Brindley, R., Frith, C. D. & Burgess, P. W. Atypical recruitment of medial prefrontal cortex in autism spectrum disorders: an fMRI study of two executive function tasks. Neuropsychologia 46, 2281–2291 (2008).
-
Just, M. A., Cherkassky, V. L., Keller, T. A., Kana, R. K. & Minshew, N. J. Functional and anatomical cortical underconnectivity in autism: evidence from an FMRI study of an executive function task and corpus callosum morphometry. Cereb. Cortex 17, 951–961 (2007).
-
Knaus, T. A., Silver, A. M., Lindgren, K. A., Hadjikhani, N. & Tager-Flusberg, H. fMRI activation during a language task in adolescents with ASD. J. Int. Neuropsychol. Soc. 14, 967–979 (2008).
-
Greene, A. S., Horien, C., Barson, D., Scheinost, D. & Constable, R. T. Why is everyone talking about brain state? Trends Neurosci. 46, 508–524 (2023).
-
Finn, E. S. & Rosenberg, M. D. Beyond fingerprinting: choosing predictive connectomes over reliable connectomes. Neuroimage 239, 118254 (2021).
-
Rai, S., Graff, K., Tansey, R. & Bray, S. How do tasks impact the reliability of fMRI functional connectivity? Hum. Brain Mapp. 45, e26535 (2024).
-
Sripada, C., Angstadt, M., Rutherford, S., Taxali, A. & Shedden, K. Toward a “treadmill test” for cognition: improved prediction of general cognitive ability from the task activated brain. Hum. Brain Mapp. 41, 3186–3197 (2020).
-
Chou, Y. H. et al. Maintenance and representation of mind wandering during resting-state fMRI. Sci. Rep. 7, 40722 (2017).
-
Bettoni, R. et al. Learning and generalization of repetition-based rules in autism. Psychol. Res. 87, 1429–1438 (2023).
-
Di Martino, A. et al. Shared and distinct intrinsic functional network centrality in autism and attention-deficit/hyperactivity disorder. Biol. Psychiatry 74, 623–632 (2013).
-
Itahashi, T. et al. Neural correlates of shared sensory symptoms in autism and attention-deficit/hyperactivity disorder. Brain Commun. 2, fcaa186 (2020).
-
Greene, A. S. & Constable, R. T. Clinical promise of brain–phenotype modeling: a review. JAMA Psychiatry 80, 848–854 (2023).
-
Nichols, A. L. A., Eichler, T., Latham, R. & Zimmer, M. A global brain state underlies C. elegans sleep behavior. Science https://doi.org/10.1126/science.aam6851 (2017).
-
Dal Monte, O., Chu, C. C. J., Fagan, N. A. & Chang, S. W. C. Specialized medial prefrontal–amygdala coordination in other-regarding decision preference. Nat. Neurosci. 23, 565–574 (2020).
-
Harikumar, A., Evans, D. W., Dougherty, C. C., Carpenter, K. L. H. & Michael, A. M. A review of the default mode network in autism spectrum disorders and attention deficit hyperactivity disorder. Brain Connect. 11, 253–263 (2021).
-
Menon, V. 20 years of the default mode network: a review and synthesis. Neuron 111, 2469–2487 (2023).
-
Norman, L. J. et al. Cross-sectional mega-analysis of resting-state alterations associated with autism and attention-deficit/hyperactivity disorder in children and adolescents. Nat. Ment. Health 3, 709–723 (2025).
-
Chopra, S. et al. Generalizable and replicable brain-based predictions of cognitive functioning across common psychiatric illness. Sci. Adv. 10, eadn1862 (2024).
-
Segura, P. et al. Connectome-based symptom mapping and in silico related gene expression in children with autism and/or attention-deficit/hyperactivity disorder. Mol. Psychiatry https://doi.org/10.1038/s41380-025-03205-8 (2026).
-
Caspi, A. et al. The p factor: one general psychopathology factor in the structure of psychiatric disorders? Clin. Psychol. Sci. 2, 119–137 (2014).
-
Watts, A. L., Greene, A. L., Bonifay, W. & Fried, E. I. A critical evaluation of the p-factor literature. Nat. Rev. Psychol. 3, 73–90 (2024).
-
Kafri, R., Levy, M. & Pilpel, Y. The regulatory utilization of genetic redundancy through responsive backup circuits. Proc. Natl Acad. Sci. USA 103, 11653–11658 (2006).
-
Tononi, G., Sporns, O. & Edelman, G. M. Measures of degeneracy and redundancy in biological networks. Proc. Natl Acad. Sci. USA 96, 3257–3262 (1999).
-
Edelman, G. M. & Gally, J. A. Degeneracy and complexity in biological systems. Proc. Natl Acad. Sci. USA 98, 13763–13768 (2001).
-
Bedford, S. A. et al. Large-scale analyses of the relationship between sex, age and intelligence quotient heterogeneity and cortical morphometry in autism spectrum disorder. Mol. Psychiatry 25, 614–628 (2020).
-
Lai, M. C. et al. Imaging sex/gender and autism in the brain: etiological implications. J. Neurosci. Res. 95, 380–397 (2017).
-
Floris, D. L. et al. Towards robust and replicable sex differences in the intrinsic brain function of autism. Mol. Autism 12, 19 (2021).
-
Chouinard, B., Gallagher, L. & Kelly, C. He said, she said: autism spectrum diagnosis and gender differentially affect relationships between executive functions and social communication. Autism 23, 1793–1804 (2019).
-
Vanderwal, T., Eilbott, J. & Castellanos, F. X. Movies in the magnet: naturalistic paradigms in developmental functional neuroimaging. Dev. Cogn. Neurosci. 36, 100600 (2019).
-
Manoli, A., Van Overwalle, F., Grosse Wiesmann, C. & Valk, S. L. Functional recruitment and connectivity of the cerebellum is associated with the emergence of Theory of Mind in early childhood. Nat. Commun. 16, 5273 (2025).
-
Rosenberg, M. D. & Finn, E. S. How to establish robust brain–behavior relationships without thousands of individuals. Nat. Neurosci. 25, 835–837 (2022).
-
Spisak, T., Bingel, U. & Wager, T. D. Multivariate BWAS can be replicable with moderate sample sizes. Nature 615, E4–E7 (2023).
-
Kang, K. et al. Study design features increase replicability in brain-wide association studies. Nature https://doi.org/10.1038/s41586-024-08260-9 (2024).
-
Kiar, G. et al. Why experimental variation in neuroimaging should be embraced. Nat. Commun. 15, 9411 (2024).
-
Ooi, L. Q. R. et al. Longer scans boost prediction and cut costs in brain-wide association studies. Nature https://doi.org/10.1038/s41586-025-09250-1 (2025).
-
Marek, S. et al. Reproducible brain-wide association studies require thousands of individuals. Nature 603, 654–660 (2022).
-
Alexander, L. M. et al. An open resource for transdiagnostic research in pediatric mental health and learning disorders. Sci. Data 4, 170181 (2017).
-
Adkinson, B. D. et al. Brain–phenotype predictions of language and executive function can survive across diverse real-world data: dataset shifts in developmental populations. Dev. Cogn. Neurosci. 70, 101464 (2024).
-
Joshi, A. et al. Unified framework for development, deployment and robust testing of neuroimaging algorithms. Neuroinformatics 9, 69–84 (2011).
-
Lutkenhoff, E. S. et al. Optimized brain extraction for pathological brains (optiBET). PLoS ONE 9, e115551 (2014).
-
SPM8 (Statistical Parametric Mapping, 2009); https://www.fil.ion.ucl.ac.uk/spm/software/spm8
-
Satterthwaite, T. D. et al. An improved framework for confound regression and filtering for control of motion artifact in the preprocessing of resting-state functional connectivity data. Neuroimage 64, 240–256 (2013).
-
Horien, C., Shen, X. L., Scheinost, D. & Constable, R. T. The individual functional connectome is unique and stable over months to years. Neuroimage 189, 676–687 (2019).
-
Buckner, R. L., Krienen, F. M., Castellanos, A., Diaz, J. C. & Yeo, B. T. The organization of the human cerebellum estimated by intrinsic functional connectivity. J. Neurophysiol. 106, 2322–2345 (2011).
-
Scheinost, D. et al. Ten simple rules for predictive modeling of individual differences in neuroimaging. Neuroimage 193, 35–45 (2019).
-
Benjamini, Y. & Hochberg, Y. Controlling the false discovery rate: a practical and powerful approach to multiple testing. J. R. Stat. Soc. B 57, 289–300 (1995).
-
Yip, S. W., Scheinost, D., Potenza, M. N. & Carroll, K. M. Connectome-based prediction of cocaine abstinence. Am. J. Psychiatry 176, 156–164 (2019).
-
Rosenberg, M. D. et al. Methylphenidate modulates functional network connectivity to enhance attention. J. Neurosci. 36, 9547–9557 (2016).
Acknowledgements
This work was supported by the National Institutes of Health (P50MH115716, T32GM007205 to C.H. and A.S.G., R25MH119043 to C.H. and TR001864 to A.S.G.). We thank H. Sarofin and C. McMurray for assistance during the MRI sessions and J. Bhawnani for assistance with hardware and software. We also thank S. Fontenelle IV, E. Brennan-Wydra, C. Banarjee, R. Foster, V. Donthireddy, K. Joseph, N. Powell, C. Nutor, D. Fortes and M. Butler for assistance with data collection and collation.
Ethics declarations
Competing interests
J.C.M. consults or has consulted with Customer Value Partners, Bridgebio, Determined Health, Apple and BlackThorn Therapeutics, has received research funding from Janssen Research and Development, serves on the scientific advisory boards of Pastorus and Modern Clinics, and receives royalties from Guilford Press, Lambert, Oxford and Springer. B.D.A. is a founder of Elevation Admissions. The other authors declare no competing interests.
Peer review
Peer review information
Nature Mental Health thanks Colin Hawco and the other, anonymous, reviewer(s) for their contribution to the peer review of this work.
Additional information
Publisher’s note Springer Nature remains neutral with regard to jurisdictional claims in published maps and institutional affiliations.
Supplementary information
Rights and permissions
Open Access This article is licensed under a Creative Commons Attribution-NonCommercial-NoDerivatives 4.0 International License, which permits any non-commercial use, sharing, distribution and reproduction in any medium or format, as long as you give appropriate credit to the original author(s) and the source, provide a link to the Creative Commons licence, and indicate if you modified the licensed material. You do not have permission under this licence to share adapted material derived from this article or parts of it. The images or other third party material in this article are included in the article’s Creative Commons licence, unless indicated otherwise in a credit line to the material. If material is not included in the article’s Creative Commons licence and your intended use is not permitted by statutory regulation or exceeds the permitted use, you will need to obtain permission directly from the copyright holder. To view a copy of this licence, visit http://creativecommons.org/licenses/by-nc-nd/4.0/.
About this article

Cite this article
Horien, C., Mandino, F., Greene, A.S. et al. Optimizing functional connectivity scanning conditions for predicting autistic traits. Nat. Mental Health (2026). https://doi.org/10.1038/s44220-026-00623-7
-
Received:
-
Accepted:
-
Published:
-
Version of record:
-
DOI: https://doi.org/10.1038/s44220-026-00623-7
Leave a Reply