
⏱ 14 min read
Main
Over 11,000 papers have been published to date to investigate the structural and functional neuroimaging correlates of depression (based on a PubMed search for the keyword string ‘neuroimaging depression’). However, recent meta-analyses attempting to collate results across previous studies have reported null findings1,2,3,4, indicating a troubling lack of consistency in neuroimaging correlates of depression across the substantive existing literature. Sampling variability arising from underpowered study samples that comprise each meta-analysis may explain these null findings5, and such within-cohort sample size challenges are often present even in large-scale studies of the neural correlates of depression6,7. As such, a conclusive mapping of the neuroimaging correlates of depression remains unknown. In this study, we aimed to comprehensively identify the most reliable structural and resting state functional neuroimaging correlates of depression across six large-scale datasets.
Beyond sampling variability in underpowered studies, there are several other challenges that may contribute to the observed inconsistencies in the literature on neuroimaging correlates of depression. For example, there are multiple self-reported phenotypic definitions of depression in common use, which are broadly based on either symptom severity or trait-level personality-based susceptibility indexed using the neuroticism personality trait8,9. Although high neuroticism is a strong predictor of depression10,11, it is also linked to other psychiatric disorders, including anxiety and substance use12, and is therefore less specific to depression symptomatology than symptom severity measures. Furthermore, the literature on neuroimaging correlates of depression has largely focused on higher-order cortical systems13 and subcortical regions14, which may have systematically resulted in under-reporting in other regions of the brain. To address these challenges, we determined the unbiased whole-brain spatial distribution of the structural and functional neuroimaging correlates reliably associated with symptom severity versus personality-based susceptibility phenotypes of depression.
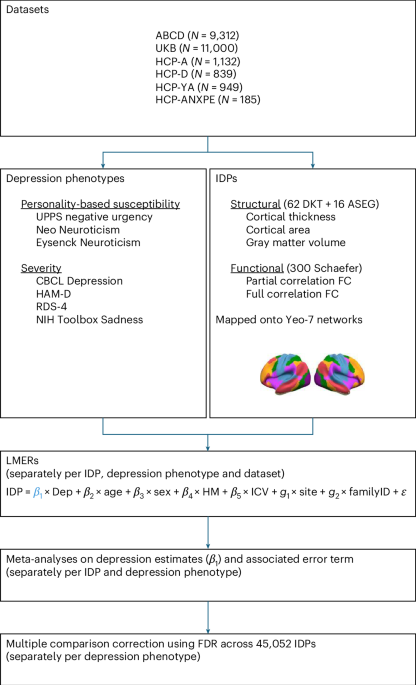
We used six state-of-the-art large-scale datasets to comprehensively map the parcellated structural and resting state functional neuroimaging correlates of depression. Each dataset was analyzed separately and estimates were subsequently meta-analytically combined to establish the most reliable neuroimaging correlates of depression robust to sampling variability, phenotypic definitions and regional bias (Fig. 1). We purposefully chose to treat the six datasets included in this study separately rather than harmonizing all data into one mega sample. This approach was selected because perfect harmonization is not feasible15, especially when factors of importance (such as age range) are fully co-linear with dataset separation. Furthermore, non-removal of study differences (for example, in relation to preprocessing, sample definition, depression instruments and so on) offers a testbed for the type of realistic study-to-study variation observed in the literature. Notably, sufficiently large datasets with gold standard clinician-based diagnostics are lacking, so this study leveraged self-reported measures of symptom severity and personality-based susceptibility as phenotypes of depression.
From each of the 6 datasets, we extract 1 available depression severity phenotype and 1 available depression personality-based susceptibility phenotype, and 89,902 matched IDPs. To estimate the association of each IDP with each depression phenotype, univariate within-dataset analyses were performed using LMERs and the results were entered into univariate meta-analyses to combine across datasets, followed by multiple comparison correction using FDR. See the Methods for more information. UPPS negative urgency, Urgency-Premeditation-Perseverance-Sensation seeking negative urgency subscale; RDS-4, Recent Depressive Symptoms Scale; FC, functional connectivity; HM, head motion; ICV, intracranial volume; Dep, depression phenotypes.
Our findings identified significant structural neuroimaging correlates of depression symptoms. Brain regions with the strongest and most robust reductions in gray matter volume/cortical surface area associated with depression included the frontal cortex, anterior cingulate and insula (Table 1). With regard to the whole-brain spatial distribution, significant structural neuroimaging correlates of depression symptoms included visual and somatomotor regions (for example, reduced volume/area in paracentral, postcentral, precentral, fusiform and pericalcarine regions), but no subcortical regions, shedding new light on key brain regions involved in the pathophysiology of depression. Taken together, this study substantially expands our understanding of the neuroimaging correlates of depression.
Results
Structural neuroimaging correlates of depression
To establish the structural and functional neuroimaging correlates of depression, we comprehensively analyzed six existing datasets (Table 2), including the Adolescent Brain Cognitive Development (ABCD) study16, the UK Biobank (UKB) study17, the Human Connectome Project (HCP) Young Adult (HCP-YA) study18, the HCP Development (HCP-D) study19, the HCP Aging (HCP-A) study20 and the HCP Dimensional Connectomics of Anxious Misery (ANXPE) study21. Depression severity (Table 3) was quantified based on available metrics in each dataset, using either the Hamilton Depression Rating Scale22 (ANXPE), NIH Toolbox Sadness23 (HCP-YA and HCP-A), Child Behavior Checklist (CBCL) Depression subscale24 (HCP-D and ABCD) or Recent Depressive Symptoms (RDS) scale25 (UKB). Personality-based depression susceptibility (Table 3) was similarly quantified using dataset-specific measures, namely the Eysenck Neuroticism26 (UKB), NEO Five-Factors Inventory Questionnaire Neuroticism subscale (HCP-YA, HCP-A and ANXPE) or UPPS negative urgency27 (HCP-D and ABCD). Depression severity and personality-based susceptibility score distributions for each dataset are provided in Supplementary Fig. 1.
Parcellated structural magnetic resonance imaging (MRI; Table 4) metrics (gray matter volume, cortical thickness and cortical surface area) were calculated for 62 brain regions in the Freesurfer Desikan–Killiany–Tourville (DKT)28 atlas, and—for gray matter volume—16 subcortical regions in the Freesurfer automatic subcortical segmentation (ASEG)29 atlas. Two types of functional connectivity measure were included, namely the full correlation and the regularized partial correlation between pairs of parcel timeseries using the Schaefer30 300-dimensional atlas. Mass univariate linear mixed-effects regression (LMER) models were fit to separately estimate each imaging-derived phenotype (IDP) based on one of the depression phenotypes (severity or personality-based susceptibility) and confounds (age, sex, total intracranial volume, head motion, imaging site and family group, as relevant for each dataset). LMER effect size and error estimates from each of the six datasets were subsequently entered into mass univariate meta-analyses to calculate overall brain–depression effect sizes separately for each IDP and each depression phenotype. False discovery rate (FDR) correction was performed to control meta-analysis results for multiple comparisons across all structural and functional imaging measures within each depression phenotype, such that no significance is reported at the study level.
The results revealed robust structural neuroimaging correlates of depression. The most consistent neural correlates of depression were reduced gray matter volume/cortical surface area in the superior frontal cortex, middle frontal cortex, orbitofrontal cortex, rostral anterior cingulate and insula (Fig. 2; dataset-specific version of Fig. 2 available in Supplementary Fig. 2; full set of tabulated results included as online resource on GitHub—see the Code availability statement for link). Among significant regional findings, there was substantial agreement both bilaterally and between gray matter volume and cortical surface area (Table 1).
Results are collated across six large-scale datasets for depression severity (a–e) and personality-based susceptibility (f–j) phenotypes. Each row represents one imaging measure: cortical surface area (a,f), cortical and subcortical gray matter volume (b,g), cortical thickness (c,h), partial functional connectivity (d,i), and full functional connectivity (e,j). Volcano plots reveal meta-analytical estimates, with significant imaging measures indicated by crosses. Effect sizes reflect the meta-analytical estimate (beta). Results are shown on the parcellated cortical surface unthresholded (cold–warm color bar) and after thresholding (yellow; where significant). For functional connectivity, cortical surface figures show the absolute average across a row of the correlation matrix with the sign determined by the mode of the sign across the row (for example, negative sign if more edges of a brain region are negative than positive). Separate figures for each dataset are available in Supplementary Fig. 2.
Importantly, the meta-analysis did not indicate significant gray matter volume changes associated with depression severity or personality-based susceptibility in any of the 16 subcortical regions. Notably, none of the subcortical results achieved significance before multiple comparison correction either, although uncorrected trends were observed in the bilateral amygdala, left hippocampus and right accumbens (GitHub Resource: Table GR1). The absence of subcortical results was not explained by age-based heterogeneity, because separate meta-analyses for each age range also did not reveal any significant subcortical associations (GitHub Resource: Table GR2). We further tested whether nonlinear associations between severity and/or personality-based susceptibility measures and subcortical volumes may be present (GitHub Resource: Table GR3). Findings revealed significant nonlinear associations of the pallidum in both developmental cohorts (ABCD and HCP-D), and for the hippocampus in both aging cohorts (UKB and HCP-A; Supplementary Fig. 3). For example, associations in the hippocampus showed a relatively steep association with lower hippocampal volume for the highest severity/susceptibility ranges, and this association flattened or even reversed at average or low severity/susceptibility ranges.
Similarly, the meta-analysis did not indicate significant cortical thickness changes associated with depression severity or personality-based susceptibility. This null finding for cortical thickness was also not explained by multiple comparison correction because only 4 of 124 cortical thickness IDPs were significant before FDR correction (well below the 5% expected false positive rate without correction for multiple comparisons). It is possible that the null findings for cortical thickness were partly linked to lifespan differences, because separate meta-analyses in the developmental age range did reveal five cortical thickness IDPs with significant positive associations with depression severity (GitHub Resource: Table GR2), although further exploration of age-stratified results (Appendix 1) did not reveal consistent cortical thickness findings across the lifespan.
Despite known heterogeneity in the datasets with respect to clinical severity, age and treatment status, statistical tests revealed relatively low heterogeneity (GitHub Resource: Table GR4). After correction for multiple comparisons, fewer than 1% of gray matter volume and cortical area measures showed significant levels of heterogeneity, whereas approximately 5% of cortical surface measures showed significant levels of heterogeneity (Supplementary Table 1).
Functional correlates of depression
Surprisingly, our meta-analysis found no partial functional connectivity results that reached significance after correction for multiple comparisons for depression severity and only two partial functional connectivity edges that reached significance for personality-based depression susceptibility (Fig. 2). Specifically, depression susceptibility was associated with increased partial functional connectivity between the right anterior temporal cortex and the right medial prefrontal cortex and with increased partial functional connectivity between the left medial prefrontal cortex and the left ventral prefrontal cortex. The small number of partial functional connectivity edges associated with depression was not explained by multiple comparison correction. Even though 1,780 partial connectivity edges passed the uncorrected threshold for association with depression severity and 1,657 edges for depression susceptibility, these only represent 4.0% and 3.7% respectively of 44,850 total edges (well within the 5% expected false positives without correction for multiple comparisons). The null results for partial functional connectivity were also not explained by age-based heterogeneity, because separate meta-analyses for each age range did not reveal any significant partial connectivity associations (GitHub Resource: Table GR2), and only a small number of partial functional connectivity edges showed consistent effect size differences when comparing developmental and aging results (Appendix 1).
Out of 44,850 unique full correlation edges in a 300 by 300 connectivity matrix, 102 edges were significantly associated with depression severity and 129 were significantly associated with depression susceptibility (Supplementary Fig. 4). For both depression measures, the two networks with the highest number of significant edges were the default mode network and the somatomotor network. Notably, out of the significant full correlation edges, the convergence between associations with severity and susceptibility was substantially lower than that observed for structural IDPs (Table 1).
Importantly, however, heterogeneity levels differed substantially between full and partial functional connectivity measures (GitHub Resource: Table GR4). After correction for multiple comparisons, less than 1% of partial functional connectivity measures showed significant heterogeneity, whereas 25% of full functional connectivity measures showed evidence of significant heterogeneity across datasets (Supplementary Table 1). Taken together with the lack of convergence between depression phenotypes, these findings raise caution for the interpretability of full functional connectivity results.
Structural versus functional correlates of depression
To further enable quantification of direct comparisons between the effect sizes of structural and functional neuroimaging correlates of depression, we performed a two-way analysis of variance (ANOVA) with a main effect for imaging metric type (five levels; gray matter volume, cortical surface area, cortical thickness, partial functional connectivity and full functional connectivity), a main effect for depression phenotype (two levels; severity and susceptibility) and the interaction effect (imaging metric type × depression phenotype) on the absolute values of the meta-analytical effect sizes as the inputs. Importantly, this analysis was performed on all effect sizes (regardless of significance after multiple comparison correction) and can therefore pick up broader trends beyond the univariate results described above.
The results revealed a significant main effect of imaging metric type (F = 5,081.7, P < 0.1 × 10−999), a significant main effect of depression phenotype (F = 198.1, P = 5.77 × 10−45) and a significant interaction effect (F = 91.9, P = 3.4 × 10−78). Post hoc results revealed significantly higher effect sizes for depression severity compared with personality-based susceptibility (especially for gray matter volume and cortical surface area). Post hoc results further indicated significant differences between each pair of imaging metric types apart from cortical thickness compared with partial functional connectivity, with especially larger effect sizes for gray matter volume and cortical surface area and lowest effect sizes for partial functional connectivity (Fig. 3).
Absolute meta-analytical estimates are shown as a function of imaging metric type and depression phenotype. Violin plots show the distribution of absolute meta-analytic estimates for each imaging metric type, separately for susceptibility (gray) and severity (blue), with violin width reflecting the kernel density estimate of the estimates. The embedded box plots show the median (center line), interquartile range (box) and whiskers extending to the lowest and highest observations within 1.5 × interquartile ranges of the lower and upper quartiles. For each phenotype, the number of meta-analytic estimates contributing to each violin was partial functional connectivity, n = 44,850; full functional connectivity, n = 44,850; cortical surface area, n = 62; gray matter volume, n = 78; and cortical thickness, n = 62. Results show larger effects for severity (blue) compared with personality-based susceptibility (gray), especially for gray matter volume and surface area. FC, functional connectivity.
Visual and somatomotor involvement in depression
To systematically summarize the spatial distribution of neuroimaging correlates of depression, we assigned each parcel (from DKT or Schaefer atlases) to one of seven cortical networks as defined by Yeo et al.31 or to an eighth combined subcortical network (ASEG) based on maximal spatial overlap. We then performed ANOVAs with a main effect for Yeo network (seven or eight levels; depending on the inclusion/exclusion of subcortical regions), a main effect for depression phenotype (two levels; severity and susceptibility) and the interaction effect (Yeo network × depression phenotype) on the absolute values of the meta-analytical effect sizes as the inputs. Analyses were performed separately for each of the three imaging metric types with significant meta-analytical results (namely gray matter volume, cortical surface area and full functional connectivity).
The results revealed a significant main effect of Yeo network for gray matter volume (F = 10.1, P = 3.5 × 10⁻¹⁰) and for full functional connectivity (F = 333.5, P < 0.1 × 10−999), but not for cortical surface area (F = 1.32, P = 0.25). The main effect for gray matter volume was driven by relatively lower effect sizes for subcortical regions (Fig. 4a and Supplementary Fig. 5a). For full functional connectivity, the highest effect sizes were observed in the somatomotor, dorsal and ventral attention networks (Fig. 4c and Supplementary Fig. 5c).
a–c, Meta-analytical estimates (absolute) as a function of spatial network organization (x-axis categories) and depression phenotype (gray, personality-based susceptibility; blue, severity), shown separately for gray matter volume (a), cortical surface area (b) and full functional connectivity (c). Violin plots show the distribution of absolute meta-analytic estimates for each Yeo network, separately for susceptibility (gray) and severity (blue), with violin width reflecting the kernel density estimate of the estimates. The embedded box plots show the median (center line), interquartile range (box) and whiskers extending to the lowest and highest observations within 1.5 × interquartile ranges of the lower and upper quartiles. For each phenotype, the number of meta-analytic estimates contributing to each violin was, for gray matter volume, visual, n = 11; somatomotor, n = 10; dorsal attention, n = 2; ventral attention, n = 9; limbic, n = 8; frontoparietal, n = 4; default, n = 18; and subcortical, n = 16; for cortical surface area, visual, n = 11; somatomotor, n = 10; dorsal attention, n = 2; ventral attention, n = 9; limbic, n = 8; frontoparietal, n = 4; and default, n = 18; and for full functional connectivity, visual, n = 9,854; somatomotor, n = 10,681; dorsal attention, n = 4,977; ventral attention, n = 4,916; limbic, n = 2,888; frontoparietal, n = 4,740; and default, n = 6,794. Notably, the ‘limbic’ network in Fig. 4 refers to the Yeo-7 cortical definition of limbic regions (that is, medial and lateral orbitofrontal cortex, inferior temporal cortex and entorhinal cortex) and does not include subcortical contributions. A version of this figure with severity and susceptibility collapsed for each network is available in Supplementary Fig. 5.
Interestingly, post hoc comparisons of the ANOVA results for gray matter volume and cortical surface area did not indicate any significant differences between cortical networks (P > 0.25). Although more brain regions in the default mode, frontoparietal and limbic networks showed significant associations with depression (Table 1), multiple robustly significant structural and functional associations with depression were also observed for regions in the somatomotor and visual networks. Consistent with the highest full functional connectivity associations in the somatomotor network, depression severity was associated with reduced gray matter volume and/or cortical surface area in paracentral, postcentral, precentral and fusiform regions, whereas personality-based depression susceptibility was associated with reduced gray matter volume and/or cortical surface area in the pericalcarine region.
Unique neuroimaging correlates of severity versus personality-based susceptibility
Variability in depression phenotypes is one potential reason for the observed inconsistencies across the literature on neuroimaging correlates of depression. We directly compared the neuroimaging correlates across two classes of depression phenotypes, namely instruments that measure depression severity versus instruments that measure the personality trait neuroticism as a proxy for depression susceptibility. To assess systematic differences in meta-analytic effect sizes, the same ANOVAs for gray matter volume, cortical surface area and full functional connectivity described above—which included a main effect for depression phenotype and an interaction effect (depression phenotype by network)—were used. Notably, the exact instrument within each class of depression phenotype varied across the datasets. To assess the interoperability of instruments of severity/susceptibility, we compared brain–depression associations at the dataset level between datasets with the same or different instruments (Appendix 1).
In the ANOVAs for gray matter volume, both the main effect of depression phenotype (F = 5.16, P = 2.46 × 10⁻²) and the interaction effect (depression phenotype by network; F = 2.19, P = 3.89 × 10⁻²) were significant. Post hoc comparisons indicated that the main effect was driven by larger effect sizes for severity compared with susceptibility. This is consistent with the univariate thresholded results, which indicated 38 significant hits for severity compared with 22 significant hits for personality-based susceptibility (Table 1). Interaction effects were driven by lower effect sizes in subcortical regions as discussed above. Similarly, for full functional connectivity, both the main effect of depression phenotype (F = 387.8, P = 2.58 × 10−88) and the interaction effect (F = 94.94, P = 1.99 × 10−119) were significant. For cortical surface area, neither the main effect of depression phenotype (F = 1.83, P = 0.17) nor the interaction effect (F = 1.09, P = 0.37) reached significance. Dataset comparisons did not reveal greater similarity of brain–depression associations when using the same instrument compared with different instruments (Appendix 1), providing preliminary support for the interoperability of depression phenotypes.
Discussion
Despite substantial investigation, attempts to establish the neural correlates of depression have achieved inconsistent findings and evaded reproducibility. Throughout the paper, we used the term ‘depression’ to refer to depression symptoms broadly rather than to major depressive disorder specifically. In this study, we comprehensively analyzed the structural and functional neuroimaging correlates of self-reported depression across six large-scale datasets and meta-analytically combined results to establish the most reliable brain regions involved in the psychophysiology of depression. Overall, we found significant structural and functional correlates of depression. Although significant and robust across datasets, the observed effect sizes of the associations were relatively small, consistent with previous research5. Surprisingly, our results did not indicate significant subcortical neuroimaging correlates of depression, whereas significant reductions in gray matter volume and cortical area were observed in somatomotor and visual regions not commonly associated with depression.
Our findings revealed that depression was associated with significant reductions in gray matter volume and cortical surface area in the superior frontal cortex, middle frontal cortex, orbitofrontal cortex, rostral anterior cingulate and insula. No significant meta-analytical results were observed for cortical thickness, which may be explained by recent findings revealing extensive heterogeneity in cortical thickness changes associated with depression32. Alternatively, the lack of cortical thickness results may be explained by uncorrelated variance across individuals related to cortical folding patterns33. Overall, these findings are consistent with previous voxel-based meta-analytical studies34,35,36,37 and point to the importance of frontal regions in depression.
Our findings revealed differences between full and partial correlation functional connectivity, with more extensive edges reaching meta-analytical significance in full compared with partial connectivity. Notably, comparisons across age ranges indicated stronger associations of both depression severity and susceptibility for many full correlation edges in development compared with aging (Appendix 1). Future research may wish to develop a more detailed mapping of changes in the functional connectivity correlates of depression across the lifespan. Apart from lifespan effects, differences between full and partial connectivity findings may reflect the relative sparseness of partial compared with full connectivity and/or the higher level of between-study meta-analytical heterogeneity in full compared with partial connectivity.
The two partial functional connectivity measures associated with higher personality-based depression susceptibility reflected increased connectivity within the default mode network and increased connectivity between frontoparietal and default mode networks. These findings are consistent with previous foundational work examining default mode abnormalities in depression13,38,39,40. Previous work has furthermore linked increased activity within the default mode network with increased rumination41,42 and self-referential thinking43. As such, our partial functional connectivity findings support the role of rumination in personality-based depression susceptibility42.
Our findings revealed significantly lower effect sizes in the subcortical network compared with cortical networks. This finding is surprising given previous research indicating associations between depression and volume of several subcortical regions6 including the hippocampus44. Nevertheless, our findings are consistent with recent work showing chance-level multivariate classification of major depressive disorder, where subcortical volumes became uninformative for classification after careful harmonization for site effects45. The absence of subcortical findings persisted in age-stratified meta-analyses, although our findings did point to nonlinear associations in the pallidum for developmental cohorts and in the hippocampus for aging cohorts. As such, further work is needed to reconcile structural findings in the subcortex linked to depression. For example, it is possible that subcortical volume loss is characteristic of more severe depression than captured in these population datasets or that subcortical volume loss is specifically impacted by depression duration46,47,48.
The literature on the structural and functional neuroimaging correlates of depression has largely focused on subcortical regions (for example, amygdala and hippocampus) and higher-order cortical networks (for example, regions of the default mode, frontoparietal and executive control networks)13,14. We aimed to perform an unbiased search for the structural and functional neuroimaging correlates of depression across the whole brain. Qualitatively, the meta-analytical results summarized in Fig. 2 reveal a diffuse whole-brain pattern of associations with depression49. Although the majority of findings involved default mode, frontoparietal and limbic regions, multiple unexpected structural associations with depression were also observed in somatomotor (paracentral, postcentral and precentral) and visual (fusiform and pericalcarine) regions. Recent studies have started to acknowledge and discuss the role of the visual and somatomotor networks in depression50,51,52,53, but attention on these findings remains limited. Our results substantiate structural associations of the visual and somatomotor networks in depression, highlighting the need to improve unbiased reporting and future research into potential explanatory mechanisms. In relation to the role of somatomotor networks in depression, recent studies have revealed the transdiagnostic nature of somatomotor abnormalities across multiple psychiatric and cognitive domains54,55,56,57. These findings indicate a need for increased research focus on the role of the visual and somatomotor regions in depression.
Heterogeneity forms an important challenge in depression research and in meta-analytical studies more broadly. When quantifying between-study heterogeneity in our datasets, our results revealed minimal heterogeneity in the majority of the imaging metrics. The only imaging metric type with significant heterogeneity was full—but not partial—functional connectivity. As such, the structural correlates of depression discussed here do not appear to be impacted by between-study heterogeneity, but care should be taken to interpret the functional correlates of depression. More complex sources of heterogeneity may still impact the associations between neuroimaging metrics and depression, such as variation in clinical profiles, transdiagnostics, and comorbidities and differences in education and/or socioeconomic status. Taken together, future research into depression heterogeneity is warranted. One especially interesting avenue for studying heterogeneity is the use of normative modeling to focus on individual-specific deviation patterns, which can uncover intersubject heterogeneity in the spatial distribution and strength of functional and structural deviations among patients with depression58,59.
Our findings revealed significantly higher effect sizes in depression severity compared with personality-based depression susceptibility. This finding suggests that direct self-report assessment of symptoms is preferable over trait-level measures of susceptibility. Even higher effect sizes may be expected when using clinician-rated diagnostic tools such as the Hamilton Depression Rating Scale (HAM-D) or the structured clinical interview for diagnosis (SCID)60,61,62,63, compared with self-reported indices of symptom severity. The comparison between severity and susceptibility confirmed that differences between depression phenotypes may contribute to the divergent results reported by neuroimaging studies. Notably, we did not observe greater convergence between studies using the same (versus different) depression measures, lending support to the interoperability of depression scales. Similarly, previous comparisons between different measures of depression have shown correlations ranging from 0.4 and 0.95 (refs. 23,25,64,65,66,67), suggesting correspondence (see ‘Depression phenotypes’ of the Methods for a detailed discussion). Nevertheless, there is an important need to assess cross-sample validation to demonstrate interoperability of different measures of depression.
This study has several limitations. This study leveraged population datasets that differ from traditional dedicated depression study samples in important ways. For example, the majority of participants were not clinically diagnosed using traditional diagnostic tools. Nevertheless, two of the studies were enriched for the presence of psychopathology by recruiting participants with high neuroticism (HCP-ANXPE21) or intentionally including participants with early signs of externalizing/internalizing (ABCD68). Furthermore, previous work has shown that depression incidence in the UKB was well matched to population estimates69, from which we subsampled those who met depression-related criteria. As such, the samples included in these meta-analyses capture a broad range of subclinical to clinical depression severity (see Supplementary Fig. 1 for the depression severity and neuroticism scores for each dataset). Nevertheless, future work is needed to assess whether our findings replicate in clinician-diagnosed datasets and samples with an even distribution of depression phenotypes. Openly shared consortia data are starting to emerge to provide large-scale clinically diagnosed datasets (albeit with small site-specific sample sizes) to facilitate such future work70,71,72. Beyond clinician-rated severity scores, phenotypic variability in symptom type forms another source of potential bias in studies of the brain basis of depression. Future work may wish to explore the meta-analytical brain basis of specific symptom domains. In addition, this study only harnessed two IDPs from resting state fMRI data, full and partial functional connectivity. Additional measures potentially relevant to depression can be extracted from resting state data73, such as network strength or size74. Although beyond the scope of this study, future meta-analytical research of these alternative resting state measures in the context of depression may be of interest. Finally, we used a linear mixed-effects model to identify relationships between depression phenotypes and IDPs, which may fail to identify nonlinear relationships. Future studies should extend this work to assess nonlinear relationships between depression and the brain.
This study provides a robust mapping of the neuroimaging correlates of self-reported depression across well-powered studies. Importantly, these findings substantially update our understanding of the neuroimaging correlates of depression by highlighting the importance of structural rather than functional associations and uncovering key somatomotor and visual contributions.
Methods
This project was considered exempt by the Washington University Institutional Review Board under exempt category (4) Secondary Research (IRB ID 202105086).
Datasets
This study leverages six different datasets, namely the ABCD study16, the UKB study17, the HCP Young Adult study18, the HCP-D study19, the HCP-A study20 and the ANXPE study21. Subjects with complete and biologically plausible imaging data were included (for example, after removing subjects with any imaging measures equal or greater than five standard deviations away from the dataset mean). In the UKB, an additional set of inclusion criteria was adopted to identify a subset of participants. Specifically, participants were included if they met one or more of three clinical depression criteria: probable major depressive disorder status, one or more reported episodes of depression, and/or ICD10 label F31 and F32. The rationale for this UKB subselection was twofold: (i) it reduced the storage and computational demands given that the full UKB is the largest sample, and (ii) it focuses on a more clinically relevant subset of UKB participants. The demographic information for each of the datasets is shown in Table 2.
Depression phenotypes
In each dataset, we identified two depression-related phenotypes to use for all linear regression analyses. The depression phenotypes fall into the categories of susceptibility and self-reported severity measures (Table 3). The susceptibility measures included Eysenck Personality Questionnaire (EPQ) Neuroticism subscale26 (UKB), NEO Five-Factors Inventory Questionnaire Neuroticism subscale (HCP-YA, HCP-A and ANXPE) and UPPS negative urgency27 (HCP-D and ABCD). The severity measures included Hamilton Depression Rating Scale22 (ANXPE), NIH Toolbox Sadness23 (HCP-YA and HCP-A), CBCL Depression subscale24 (HCP-D and ABCD) and RDS scale25 (UKB).
All susceptibility measures included here have high reliability as estimated in previous work, including the NEO Neuroticism subscale with a reliability of 0.88 (ref. 75), the Eysenck score with a reliability of 0.83 (ref. 76) and the UPPS negative urgency score with a reliability of 0.5 (ref. 77). Notably, the UPPS negative urgency subscale is somewhat different from other scales in that it is designed for use in children and measures the tendency to act hastily when in an extreme negative mood state, which previous work has linked to neuroticism and negative emotionality78. The distributions of susceptibility scores per dataset and per measure are shown in Supplementary Fig. 1.
Similarly, all severity measures have high reliability as previously reported, including the HAM-D with a reliability of 0.9 (ref. 79), the RDS with reliability of 0.88 (ref. 25), the NIH Toolbox Sadness subscale with a reliability of 0.9 (ref. 23) and the CBCL with a reliability of 0.95 (ref. 24). The CBCL differs from other severity measures in that it is completed by the parent or caregiver of the child to rate behavioral and emotional problems. Previous work has linked the CBCL Depression subscale to clinically diagnosed depressive disorders80. The distributions of severity scores per dataset and per measure are shown in Supplementary Fig. 1.
Although utilizing multiple different phenotype measures is important in identifying the robust correlates of depression, our meta-analyses are based on the assumption that depression measures evaluate a common underlying construct. Previous work has evaluated the interoperability of most of the measures included here against other common depression and neuroticism assessments, concluding strong correlation the majority of the time. For example, the NIH Toolbox depression measure, HAM-D and RDS have all been correlated with PHQ-9 (Patient Health Questionnaire-9) with a correlation of 0.84 (ref. 23), 0.72 (ref. 64) and 0.91 (ref. 25), respectively. The CBCL, however, could not be compared to these adult questionnaires as its intent for children precludes fair assessment. For the neuroticism measures, an extensive meta-analysis found strong correlation (r > 0.9) between the Eysenck and NEO-5 Neuroticism measures over 80% of the time65, whereas the UPPS Urgency subscale has a more modest association with the Eysenck and NEO-5 at r = 0.4 (ref. 66) and 0.5 (ref. 67), respectively. Taken together, these results support the interoperability of depression measures, with somewhat reduced correspondence in children.
Neuroimaging data and preprocessing
For each study, we leverage T1-weighted structural MRI data and resting state functional MRI data. An overview of the neuroimaging data acquisition parameters can be found in Table 4. We leveraged the preprocessed UKB data in volumetric (nifti) format as shared through the UKB showcase, which has undergone the UKB preprocessing pipeline81. We leveraged the preprocessed ABCD data in grayordinate (cifti) format that was preprocessed through adapted HCP-style pipelines82,83. For all HCP datasets (HCP-YA, HCP-A, HCP-D and HCP-ANXPE), we leveraged the preprocessed data in grayordinate (cifti) format that was preprocessed through the HCP preprocessing pipeline84 (including MSM-all registration85,86 and ICA-FIX cleanup87,88).
Imaging measures
To facilitate meta-analyses across studies, we used the same parcellations between datasets where possible. Specifically, for structural imaging measures, we used the DKT atlas to extract cortical thickness, area and volume measures and the ASEG to extract subcortical brain volume measures. For the functional imaging measures, we used the Schaefer parcellation (Schaefer) at a dimensionality of 300 parcels30. Two measures of functional connectivity were estimated, namely partial correlation between each possible pair of parcels calculated as the normalized inverse of the covariance matrix using L2 regularization (rho = 0.1), and simple (full) Pearson’s correlation between each possible pair of parcels. Notably, partial correlation controls for the timeseries of all other parcels and therefore provides additional confound control and sparsity89,90. Fisher’s r-to-z transformation was applied to both full and partial correlation before further analysis. We focused primarily on partial correlation connectivity in the main manuscript owing to its lower meta-analytical heterogeneity compared with full correlation connectivity (GitHub Resource: Table GR4).
Mapping parcellations to Yeo networks
For each parcel in the DKT and Schaefer atlases, we calculated the proportion of parcel vertices that overlap with each of the seven Yeo networks. Parcels were assigned to the Yeo network with the largest proportion overlap. All ASEG parcels were combined into one ‘subcortical’ network. Notably, correlation-based imaging features reflect a pair of parcels and can therefore potentially be mapped onto two different Yeo networks.
Confound variables
Unless otherwise stated, all regression analyses were controlled for age, sex, total intracranial volume (‘ICV’), head motion (‘HM’), imaging site (relevant for ABCD and UKB only, coded into sites-1 dummy variables) and family group (relevant for ABCD and HCP-YA only, treated as a random effect). For head motion, we used the mean rfMRI head motion averaged across space and time points for UKB (variable ID 25741), DVARS median for all HCP datasets (HCP-YA, HCP-A, HCP-D and HCP-ANXPE) and average framewise displacement in millimeters for ABCD.
Within-dataset regression analysis and meta-analyses
Univariate LMERs were conducted separately for each dataset to assess associations between depression phenotypes (‘Dep’) and imaging measures (‘IDP’) as shown in the following formula, where betas are effect sizes for fixed effects, g values are random effects and ε is the error term:
$$begin{array}{l}{rm{IDP}}={beta }_{1}times {rm{Dep}}+{beta }_{2}times {rm{age}}+{beta }_{3}times {rm{sex}}+{beta }_{4}times {rm{HM}}\qquadquad+{beta }_{5}times {rm{ICV}}+{g}_{1}times {rm{site}}+{g}_{2}times {rm{familyID}}+varepsilonend{array}$$
No intersect term was included as all input data were normalized before regression analyses. The regression coefficients of interest (β1) and associated error term were subsequently entered into separate meta-analyses for each depression phenotype and imaging measure to calculate the meta-analytical effect size, meta-analytical P value and meta-analytical confidence interval:
$${hat{theta}}_{rm{RE}}=frac{{sum }_{i}frac{{hat{theta }}_{i}}{{v}_{i}+{tau }^{2}}}{{sum}_{i}frac{1}{{v}_{i}+{tau }^{2}}},$$
where ({hat{theta }}_{rm{RE}}) reflects the overall random-effects (REML) pooled effect, ({hat{theta }}_{{i}}) refers to the study effect size, νi captures within-study variance and τ2 is the estimated between-study variance. For age-banded follow-up meta-analyses, the above equation was performed separately within developmental datasets (HCP-D and ABCD) and for young adult datasets (HCP-ANXPE and HCP-YA) and for aging datasets (HCP-A and UKB).
FDR correction was applied to the meta-analytical P values within each depression phenotype to control for multiple comparisons across all 89,902 imaging measures (44,850 partial functional connectivity, 44,850 full functional connectivity, 62 cortical thickness, 62 cortical surface area and 78 gray matter volume).
Nonlinearity
To explore potential nonlinearity in subcortical regions, we fitted generalized additive mixed models (GAMM) for datasets with random variables (site or family) and generalized additive models (GAM) for datasets without random variables. Models were fit separately for each depression phenotype and for each dataset, and were performed separately for all 16 measures of subcortical gray matter volume. In all models, a spline smooth term was applied on the subcortical imaging measures to allow nonlinearity, and also adjusted for age, sex, head motion and intracranial volume as covariates along with random effects (site or family) when available. To assess whether there was significant evidence for nonlinear associations, we evaluated the smooth term using both the effective degrees of freedom (edof > 1.5) and statistical significance after FDR correction (PFDR < 0.05).
Heterogeneity
To assess the degree of heterogeneity, we performed three statistical tests, namely the Cochran’s Q statistic (weighted sum of squared differences between individual study effects and the pooled effect across studies), I2 index (percentage of total variation across studies that is due to heterogeneity rather than chance) and Tau2 (estimates the true variability between the effect sizes of included studies)91,92. These three indexes of heterogeneity were calculated separately for each imaging measure and for each depression phenotype.
Statistical comparisons
Meta-analytic effect sizes were entered into several ANOVAs for further comparison. Absolute values of the meta-analytical effect sizes were used as the inputs for all ANOVAs to avoid negative and positive effects canceling out. Notably, the directionality of the effects was included in the meta-analyses described above. However, these follow-up analyses were intended to focus on overall association strength regardless of directionality, and therefore the polarity was removed. Specifically, one ANOVA was performed to statistically compare structural versus functional imaging measures and two separate ANOVAs (for two imaging metric types) were used to assess the spatial distribution and the difference between depression phenotypes, as described below:
- 1.
A two-way ANOVA with a main effect for imaging metric type (five levels; gray matter volume, cortical surface area, cortical thickness and partial and full functional connectivity), a main effect for depression phenotype (two levels; severity and susceptibility) and the interaction effect (imaging metric type × depression phenotype) was performed to robustly compare between structural and functional imaging measures.
- 2.
Two separate two-way ANOVAs with a main effect for Yeo network (seven or eight levels; depending on the inclusion/exclusion of subcortical regions), a main effect for depression phenotype (two levels; severity and susceptibility) and the interaction effect (Yeo network × depression phenotype) were performed to assess the role of spatial distribution and depression phenotype. To ensure interpretability, these ANOVAs were performed separately for gray matter volume, cortical surface area and full functional connectivity. Equivalent analyses were not performed for cortical thickness or partial functional connectivity because neither of these imaging metric types resulted in substantive significant meta-analytical results.
Reporting summary
Further information on research design is available in the Nature Portfolio Reporting Summary linked to this article.
Data availability
All datasets used in this paper have been shared online:
• UKB data are available following an access application process: https://www.ukbiobank.ac.uk/enable-your-research/apply-for-access. This research was performed under UK Biobank application number 47267.
• ABCD data were available from the NIMH Data Archive when data were obtained for this study.
• HCP-A, HCP-D and ANXPE (referred to as Dimensional Connectomics of Anxious Misery (DCAM)) data are available from the NIMH Data Archive collectively under the header of ‘CCF Data from the Human Connectome Projects’.
• HCP-YA data are available from the connectomeDB: https://db.humanconnectome.org/.
Code availability
All codes used in this paper are available via GitHub at https://github.com/kassiehamilton/WAPIAW2024.git.
References
-
Saberi, A., Mohammadi, E., Zarei, M., Eickhoff, S. B. & Tahmasian, M. Structural and functional neuroimaging of late-life depression: a coordinate-based meta-analysis. Brain Imaging Behav. https://doi.org/10.1007/s11682-021-00494-9 (2021).
-
Winter, N. R. et al. Quantifying deviations of brain structure and function in major depressive disorder across neuroimaging modalities. JAMA Psychiatry 79, 879–888 (2022).
-
Müller, V. I. et al. Altered brain activity in unipolar depression revisited: meta-analyses of neuroimaging studies. JAMA Psychiatry 74, 47–55 (2017).
-
Gray, J. P., Müller, V. I., Eickhoff, S. B. & Fox, P. T. Multimodal abnormalities of brain structure and function in major depressive disorder: a meta-analysis of neuroimaging studies. Am. J. Psychiatry https://doi.org/10.1176/appi.ajp.2019.19050560 (2020).
-
Marek, S. et al. Reproducible brain-wide association studies require thousands of individuals. Nature 603, 654–660 (2022).
-
Schmaal, L. et al. Subcortical brain alterations in major depressive disorder: findings from the ENIGMA Major Depressive Disorder working group. Mol. Psychiatry 21, 806–812 (2016).
-
Schmaal, L. et al. Cortical abnormalities in adults and adolescents with major depression based on brain scans from 20 cohorts worldwide in the ENIGMA Major Depressive Disorder Working Group. Mol. Psychiatry 22, 900–909 (2017).
-
Kendler, K. S., Neale, M. C., Kessler, R. C., Heath, A. C. & Eaves, L. J. A longitudinal twin study of personality and major depression in women. Arch. Gen. Psychiatry 50, 853–862 (1993).
-
Malouff, J. M., Thorsteinsson, E. B. & Schutte, N. S. The relationship between the five-factor model of personality and symptoms of clinical disorders: a meta-analysis. J. Psychopathol. Behav. Assess. 27, 101–114 (2005).
-
Hakulinen, C. et al. Personality and depressive symptoms: individual participant meta-analysis of 10 cohort studies: research article: personality and depression. Depress. Anxiety 32, 461–470 (2015).
-
van Eeden, W. A. et al. Neuroticism and chronicity as predictors of 9-year course of individual depressive symptoms. J. Affect. Disord. 252, 484–492 (2019).
-
Kotov, R., Gamez, W., Schmidt, F. & Watson, D. Linking ‘big’ personality traits to anxiety, depressive, and substance use disorders: a meta-analysis. Psychol. Bull. 136, 768–821 (2010).
-
Kaiser, R. H., Andrews-Hanna, J. R., Wager, T. D. & Pizzagalli, D. A. Large-scale network dysfunction in major depressive disorder: a meta-analysis of resting-state functional connectivity. JAMA Psychiatry 72, 603–611 (2015).
-
Koolschijn, P. C. M. P., van Haren, N. E. M., Lensvelt-Mulders, G. J. L. M., Hulshoff Pol, H. E. & Kahn, R. S. Brain volume abnormalities in major depressive disorder: a meta-analysis of magnetic resonance imaging studies. Hum. Brain Mapp. 30, 3719–3735 (2009).
-
Gebre, R. K. et al. Cross-scanner harmonization methods for structural MRI may need further work: a comparison study. NeuroImage 269, 119912 (2023).
-
Casey, B. J. et al. The Adolescent Brain Cognitive Development (ABCD) study: imaging acquisition across 21 sites. Dev. Cogn. Neurosci. 32, 43–54 (2018).
-
Littlejohns, T. J. et al. The UK Biobank imaging enhancement of 100,000 participants: rationale, data collection, management and future directions. Nat. Commun. 11, 2624 (2020).
-
Glasser, M. F. et al. The Human Connectome Project’s neuroimaging approach. Nat. Neurosci. 19, 1175–1187 (2016).
-
Somerville, L. H. et al. The Lifespan Human Connectome Project in Development: a large-scale study of brain connectivity development in 5–21 year olds. NeuroImage 183, 456–468 (2018).
-
Bookheimer, S. Y. et al. The Lifespan Human Connectome Project in Aging: an overview. NeuroImage 185, 335–348 (2019).
-
Seok, D. et al. Dimensional connectomics of anxious misery, a human connectome study related to human disease: overview of protocol and data quality. Neuroimage Clin. 28, 102489 (2020).
-
Hamilton, M. Development of a rating scale for primary depressive illness. Br. J. Soc. Clin. Psychol. 6, 278–296 (1967).
-
Pilkonis, P. A. et al. Assessment of self-reported negative affect in the NIH Toolbox. Psychiatry Res. 206, 88–97 (2013).
-
Achenbach, T. M. & Rescorla, L. A. Manual for the aseba preschool forms & profiles. (Univ. Vermont Research Center for Children, Youth and Families, 2000).
-
Dutt, R. K. et al. Mental health in the UK Biobank: a roadmap to self-report measures and neuroimaging correlates. Hum. Brain Mapp. 43, 816–832 (2022).
-
Eysenck, H. J. & Eysenck, S. B. G. Eysenck Personality Questionnaire Manual (Educational and Industrial Testing Service, 1975).
-
Settles, R. E. et al. Negative urgency: a personality predictor of externalizing behavior characterized by neuroticism, low conscientiousness, and disagreeableness. J. Abnorm. Psychol. 121, 160–172 (2012).
-
Klein, A. & Tourville, J. 101 labeled brain images and a consistent human cortical labeling protocol. Front. Neurosci. 6, 171 (2012).
-
Fischl, B. et al. Whole brain segmentation. Neuron 33, 341–355 (2002).
-
Schaefer, A. et al. Local-global parcellation of the human cerebral cortex from intrinsic functional connectivity MRI. Cereb. Cortex 28, 3095–3114 (2018).
-
Yeo, B. T. T. et al. The organization of the human cerebral cortex estimated by intrinsic functional connectivity. J. Neurophysiol. 106, 1125–1165 (2011).
-
Bayer, J. M. M. et al. Dissecting heterogeneity in cortical thickness abnormalities in major depressive disorder: a large-scale ENIGMA MDD normative modelling study. Preprint at bioRxiv https://doi.org/10.1101/2025.03.17.643677 (2025).
-
Demirci, N., Coalson, T. S., Holland, M. A., Van Essen, D. C. & Glasser, M. F. Compensating cortical thickness for cortical folding-related variation. Imaging Neurosci. 4, IMAG.a.1106 (2026).
-
Zheng, R., Zhang, Y., Yang, Z., Han, S. & Cheng, J. Reduced brain gray matter volume in patients with first-episode major depressive disorder: a quantitative meta-analysis. Front. Psychiatry 12, 671348 (2021).
-
Peng, W., Chen, Z., Yin, L., Jia, Z. & Gong, Q. Essential brain structural alterations in major depressive disorder: a voxel-wise meta-analysis on first episode, medication-naive patients. J. Affect. Disord. 199, 114–123 (2016).
-
Kandilarova, S., Stoyanov, D., Sirakov, N., Maes, M. & Specht, K. Reduced grey matter volume in frontal and temporal areas in depression: contributions from voxel-based morphometry study. Acta Neuropsychiatr. 31, 252–257 (2019).
-
Goodkind, M. et al. Identification of a common neurobiological substrate for mental illness. JAMA Psychiatry 72, 305–315 (2015).
-
Sheline, Y. I. et al. The default mode network and self-referential processes in depression. Proc. Natl Acad. Sci. USA 106, 1942–1947 (2009).
-
Whitfield-Gabrieli, S. & Ford, J. M. Default mode network activity and connectivity in psychopathology. Annu. Rev. Clin. Psychol. 8, 49–76 (2012).
-
Barreiros, A. R. et al. Intra- and inter-network connectivity of the default mode network differentiates treatment-resistant depression from treatment-sensitive depression. Neuroimage Clin. 43, 103656 (2024).
-
Zhou, H.-X. et al. Rumination and the default mode network: meta-analysis of brain imaging studies and implications for depression. NeuroImage 206, 116287 (2020).
-
Hamilton, J. P., Farmer, M., Fogelman, P. & Gotlib, I. H. Depressive rumination, the default-mode network, and the dark matter of clinical neuroscience. Biol. Psychiatry 78, 224–230 (2015).
-
Gusnard, D. A., Akbudak, E., Shulman, G. L. & Raichle, M. E. Medial prefrontal cortex and self-referential mental activity: relation to a default mode of brain function. Proc. Natl Acad. Sci. USA 98, 4259–4264 (2001).
-
Videbech, P. & Ravnkilde, B. Hippocampal volume and depression: a meta-analysis of MRI studies. Am. J. Psychiatry 161, 1957–1966 (2004).
-
Belov, V. et al. Multi-site benchmark classification of major depressive disorder using machine learning on cortical and subcortical measures. Sci. Rep. 14, 1084 (2024).
-
Sheline, Y. I., Wang, P. W., Gado, M. H., Csernansky, J. G. & Vannier, M. W. Hippocampal atrophy in recurrent major depression. Proc. Natl Acad. Sci. USA 93, 3908–3913 (1996).
-
Sheline, Y. I., Sanghavi, M., Mintun, M. A. & Gado, M. H. Depression duration but not age predicts hippocampal volume loss in medically healthy women with recurrent major depression. J. Neurosci. 19, 5034–5043 (1999).
-
Campbell, S., Marriott, M., Nahmias, C. & MacQueen, G. M. Lower hippocampal volume in patients suffering from depression: a meta-analysis. Am. J. Psychiatry 161, 598–607 (2004).
-
Cremers, H. R., Wager, T. D. & Yarkoni, T. The relation between statistical power and inference in fMRI. PLoS ONE 12, e0184923 (2017).
-
Zhang, W., Dutt, R., Lew, D., Barch, D. M. & Bijsterbosch, J. D. Higher amplitudes of visual networks are associated with trait- but not state-depression. Psychol. Med. 54, 4856–4867 (2024).
-
Wu, F., Lu, Q., Kong, Y. & Zhang, Z. A comprehensive overview of the role of visual cortex malfunction in depressive disorders: opportunities and challenges. Neurosci. Bull. https://doi.org/10.1007/s12264-023-01052-7 (2023).
-
Camacho, M. C. et al. Large-scale encoding of emotion concepts becomes increasingly similar between individuals from childhood to adolescence. Nat. Neurosci. 26, 1256–1266 (2023).
-
Javaheripour, N. et al. Altered resting-state functional connectome in major depressive disorder: a mega-analysis from the PsyMRI consortium. Transl. Psychiatry 11, 511 (2021).
-
Kebets, V. et al. Somatosensory-motor dysconnectivity spans multiple transdiagnostic dimensions of psychopathology. Biol. Psychiatry https://doi.org/10.1016/j.biopsych.2019.06.013 (2019).
-
Kent, J. S. et al. Exploring the relationship of transdiagnostic mood and psychosis symptom domains with motor dysfunction. Neuropsychobiology 79, 301–312 (2020).
-
Fritze, S. et al. Deciphering the interplay between psychopathological symptoms, sensorimotor, cognitive and global functioning: a transdiagnostic network analysis. Eur. Arch. Psychiatry Clin. Neurosci. 274, 1625–1637 (2024).
-
Huang, C.-C. et al. Transdiagnostic and illness-specific functional dysconnectivity across schizophrenia, bipolar disorder, and major depressive disorder. Biol. Psychiatry Cogn. Neurosci. Neuroimaging 5, 542–553 (2020).
-
Sun, X. et al. Mapping neurophysiological subtypes of major depressive disorder using normative models of the functional connectome. Biol. Psychiatry 94, 936–947 (2023).
-
Shao, J. et al. Capturing the individual deviations from normative models of brain structure for depression diagnosis and treatment. Biol. Psychiatry 95, 403–413 (2024).
-
Cuijpers, P., Li, J., Hofmann, S. G. & Andersson, G. Self-reported versus clinician-rated symptoms of depression as outcome measures in psychotherapy research on depression: a meta-analysis. Clin. Psychol. Rev. 30, 768–778 (2010).
-
Miguel, C. et al. Self-reports vs clinician ratings of efficacies of psychotherapies for depression: a meta-analysis of randomized trials. Epidemiol. Psychiatr. Sci. 34, e15 (2025).
-
Milak, M. S. et al. Regional brain metabolic correlates of self-reported depression severity contrasted with clinician ratings. J. Affect. Disord. 126, 113–124 (2010).
-
Kawakami, S. et al. Frontal pole-precuneus connectivity is associated with a discrepancy between self-rated and observer-rated depression severity in mood disorders: a resting-state functional magnetic resonance imaging study. Cereb. Cortex 34, bhae284 (2024).
-
Ma, S. et al. The Patient Health Questionnaire-9 vs. the Hamilton Rating Scale for Depression in assessing major depressive disorder. Front. Psychiatry 12, 747139 (2021).
-
van den Berg, S. M. et al. Harmonization of neuroticism and extraversion phenotypes across inventories and cohorts in the Genetics of Personality Consortium: an application of item response theory. Behav. Genet. 44, 295–313 (2014).
-
Keye, D., Wilhelm, O. & Oberauer, K. Structure and correlates of the German version of the brief UPPS impulsive behavior scales. Eur. J. Psychol. Assess. 25, 175–185 (2009).
-
Papachristou, H., Nederkoorn, C. & Jansen, A. Neuroticism and negative urgency in problematic alcohol use: a pilot study. Subst. Use Misuse 51, 1529–1533 (2016).
-
Garavan, H. et al. Recruiting the ABCD sample: design considerations and procedures. Dev. Cogn. Neurosci. 32, 16–22 (2018).
-
Davis, K. A. S. et al. Mental health in UK Biobank—development, implementation and results from an online questionnaire completed by 157 366 participants: a reanalysis. BJPsych Open 6, e18 (2020).
-
Fu, C. H. Y. et al. AI-based dimensional neuroimaging system for characterizing heterogeneity in brain structure and function in major depressive disorder: COORDINATE-MDD consortium design and rationale. BMC Psychiatry 23, 59 (2023).
-
Chen, X. et al. Subgenual anterior cingulate cortex functional connectivity abnormalities in depression: insights from brain imaging big data and precision-guided personalized intervention via transcranial magnetic stimulation. Sci. Bull. 70, 2676–2690 (2025).
-
Zhang, Y. et al. Dysfunction in sensorimotor and default mode networks in major depressive disorder with insights from global brain connectivity. Nat. Ment. Health 2, 1371–1381 (2024).
-
Bijsterbosch, J. D. et al. Challenges and future directions for representations of functional brain organization. Nat. Neurosci. https://doi.org/10.1038/s41593-020-00726-z (2020).
-
Lynch, C. J. et al. Frontostriatal salience network expansion in individuals in depression. Nature 633, 624–633 (2024).
-
Caruso, J. C. Reliability generalization of the NEO personality scales. Educ. Psychol. Meas. 60, 236–254 (2000).
-
Caruso, J. C., Witkiewitz, K., Belcourt-Dittloff, A. & Gottlieb, J. D. Reliability of scores from the Eysenck Personality Questionnaire: a reliability generalization study. Educ. Psychol. Meas. 61, 675–689 (2001).
-
Watts, A. L., Smith, G. T., Barch, D. M. & Sher, K. J. Factor structure, measurement and structural invariance, and external validity of an abbreviated youth version of the UPPS-P Impulsive Behavior Scale. Psychol. Assess. 32, 336–347 (2020).
-
Whiteside, S. P. & Lynam, D. R. The Five Factor Model and impulsivity: using a structural model of personality to understand impulsivity. Pers. Individ. Dif. 30, 669–689 (2001).
-
Trajković, G. et al. Reliability of the Hamilton Rating Scale for Depression: a meta-analysis over a period of 49 years. Psychiatry Res. 189, 1–9 (2011).
-
Eimecke, S. D., Remschmidt, H. & Mattejat, F. Utility of the Child Behavior Checklist in screening depressive disorders within clinical samples. J. Affect. Disord. 129, 191–197 (2011).
-
Alfaro-Almagro, F. et al. Image processing and quality control for the first 10,000 brain imaging datasets from UK Biobank. NeuroImage 166, 400–424 (2018).
-
Goncalves, M. et al. FMRIPrep Lifespan: extending a robust pipeline for functional MRI preprocessing to developmental neuroimaging. Preprint at bioRxiv https://doi.org/10.1101/2025.05.14.654069 (2025).
-
Feczko, E. et al. Adolescent Brain Cognitive Development (ABCD) community MRI collection and utilities. Preprint at bioRxiv https://doi.org/10.1101/2021.07.09.451638 (2021).
-
Glasser, M. F. et al. The minimal preprocessing pipelines for the Human Connectome Project. NeuroImage 80, 105–124 (2013).
-
Robinson, E. C. et al. Multimodal surface matching with higher-order smoothness constraints. NeuroImage 167, 453–465 (2018).
-
Robinson, E. C. et al. MSM: a new flexible framework for Multimodal Surface Matching. NeuroImage 100, 414–426 (2014).
-
Salimi-Khorshidi, G. et al. Automatic denoising of functional MRI data: combining independent component analysis and hierarchical fusion of classifiers. NeuroImage 90, 449–468 (2014).
-
Griffanti, L. et al. ICA-based artefact removal and accelerated fMRI acquisition for improved resting state network imaging. NeuroImage 95, 232–247 (2014).
-
Peterson, K. L., Sanchez-Romero, R., Mill, R. D. & Cole, M. W. Regularized partial correlation provides reliable functional connectivity estimates while correcting for widespread confounding. Imaging Neurosci. 3, IMAG.a.162 (2025).
-
Pervaiz, U., Vidaurre, D., Woolrich, M. W. & Smith, S. M. Optimising network modelling methods for fMRI. NeuroImage 211, 116604 (2020).
-
Higgins, J. P. T., Thompson, S. G., Deeks, J. J. & Altman, D. G. Measuring inconsistency in meta-analyses. Br. Med. J. 327, 557–560 (2003).
-
Huedo-Medina, T. B., Sánchez-Meca, J., Marín-Martínez, F. & Botella, J. Assessing heterogeneity in meta-analysis: Q statistic or I2 index? Psychol. Methods 11, 193–206 (2006).
Acknowledgements
The research conducted for this study included the use of the UK Biobank Resource under application number 47267. Data used in the preparation of this article included data obtained from the Adolescent Brain Cognitive Development (ABCD) Study (https://abcdstudy.org), previously held in the NIMH Data Archive (NDA) and now available from the Lasso data access platform (https://www.nbdc-datahub.org/data-tools-lasso). The ABCD is a multi-site longitudinal study designed to recruit more than 10,000 children ages 9–10 and follow them over 10 years into early adulthood. The ABCD Study is supported by the National Institutes of Health and additional federal partners under award numbers U01DA041022, U01DA041028, U01DA041048, U01DA041089, U01DA041106, U01DA041117, U01DA041120, U01DA041134, U01DA041148, U01DA041156, U01DA041174, U24DA041123, U24DA041147, U01DA041093 and U01DA041025. A full list of supporters is available at https://abcdstudy.org/federal-partners.html. A listing of participating sites and a complete listing of the study investigators can be found at https://abcdstudy.org/scientists/workgroups/. ABCD consortium investigators designed and implemented the study and/or provided data but did not necessarily participate in analysis or writing of this report. This paper reflects the views of the authors and may not reflect the opinions or views of the NIH or ABCD consortium investigators. The ABCD data repository grows and changes over time. The ABCD data used in this report came from Annual Release 2.0 (https://doi.org/10.15154/1503209). Data were provided in part by the Human Connectome Project, WU-Minn Consortium (principal investigators D. Van Essen and K. Ugurbil; 1U54MH091657) funded by the 16 NIH Institutes and Centers that support the NIH Blueprint for Neuroscience Research; and by the McDonnell Center for Systems Neuroscience at Washington University. Research reported in this publication included data from the HCP Aging project supported by the National Institute on Aging of the National Institutes of Health under award number U01AG052564 and by funds provided by the McDonnell Center for Systems Neuroscience at Washington University in St. Louis. The HCP-Aging 2.0 Release data used in this report came from https://doi.org/10.15154/1520707. Research reported in this publication included data from the HCP Development project supported by the National Institute of Mental Health of the National Institutes of Health under award number U01MH109589 and by funds provided by the McDonnell Center for Systems Neuroscience at Washington University in St. Louis. The HCP-Development 2.0 Release data used in this report came from https://doi.org/10.15154/1520708. Research reported in this publication included data from the HCP Dimensional Connectomics of Anxious Misery project supported by the National Institute of Mental Health of the National Institutes of Health under award number U01MH109991 (principal investigator Y. I. Sheline).
Funding
J.D.B. discloses support for the research of this work from the NIH (NIMH R01 MH128286), and K.M.H. discloses support for the research of this work from the NIH (R01 MH128286-03S2). Support for the computational and data storage needs of this work from the facilities of the Washington University Research Computing and Informatics Facility (RCIF), which has received funding from NIH S10 program grants 1S10OD025200-01A1 and 1S10OD030477-01. The other authors disclose no relevant funding.
Ethics declarations
Competing interests
The authors declare no competing interests.
Peer review
Peer review information
Nature Mental Health thanks Taolin Chen, Masahiro Takamura and the other, anonymous, reviewer(s) for their contribution to the peer review of this work. Peer reviewer reports are available.
Additional information
Publisher’s note Springer Nature remains neutral with regard to jurisdictional claims in published maps and institutional affiliations.
Supplementary information
Rights and permissions
Open Access This article is licensed under a Creative Commons Attribution-NonCommercial-NoDerivatives 4.0 International License, which permits any non-commercial use, sharing, distribution and reproduction in any medium or format, as long as you give appropriate credit to the original author(s) and the source, provide a link to the Creative Commons licence, and indicate if you modified the licensed material. You do not have permission under this licence to share adapted material derived from this article or parts of it. The images or other third party material in this article are included in the article’s Creative Commons licence, unless indicated otherwise in a credit line to the material. If material is not included in the article’s Creative Commons licence and your intended use is not permitted by statutory regulation or exceeds the permitted use, you will need to obtain permission directly from the copyright holder. To view a copy of this licence, visit http://creativecommons.org/licenses/by-nc-nd/4.0/.
About this article

Cite this article
Hamilton, K.M., Luo, X., Easley, T. et al. The neuroimaging correlates of depression established across six large-scale population datasets. Nat. Mental Health (2026). https://doi.org/10.1038/s44220-026-00680-y
-
Received:
-
Accepted:
-
Published:
-
Version of record:
-
DOI: https://doi.org/10.1038/s44220-026-00680-y
Leave a Reply