
⏱ 8 min read
A 2026 ABCD cohort preprint involving 10,112 youth found that childhood poverty strengthened the link between cumulative early-life adversity and later behavioral problems; among poverty-exposed youth, inhibitory-control fMRI profiles split children into higher-vulnerability and buffered pathways.
Research Highlights
- Poverty steepened adversity risk: In 10,112 ABCD youth, childhood poverty amplified the baseline early-life-adversity-to-CBCL Total Problems slope by Delta beta = 0.088 (P < .001), with a still-significant wave-4 difference of Delta beta = 0.061 (PFDR < .01).
- Two fMRI subtypes split poverty-exposed youth: HYDRA clustering of stop-signal task activation in 7,401 youth identified a stable 2-subtype solution within poverty-exposed children (ARI = 0.505; null comparison P < .05).
- Subtype-1 carried higher vulnerability: Cumulative adversity predicted behavioral problems more strongly in poverty subtype-1 than in higher-income youth (beta = 0.533 vs. 0.384; Delta beta = 0.149; P < .001).
- Subtype-2 looked buffered: Poverty subtype-2 had an adversity slope close to the higher-income group (beta = 0.433 vs. 0.384; Delta beta = 0.049; P = .135), and this lower-vulnerability profile persisted longitudinally.
- Temperament sharpened the split: Among poverty-exposed subtype-2 youth with high everyday inhibitory control, cumulative adversity no longer significantly predicted later behavioral problems at wave 3 or wave 4 (PFDR = .362 and .424).
Adversity-linked vulnerability means the slope connecting additional early-life adversity to later behavioral problems. Hu et al. treated this slope as the target: whether each added adversity translated into a larger behavioral penalty among poverty-exposed children, beyond their average symptom level at one time point.
Inhibitory control is the ability to stop an automatic response when the situation demands it. The study measured it in 2 ways: stop-signal task fMRI, which tracks brain activation during response inhibition, and caregiver-rated temperament, which captures everyday self-control.
10,112 ABCD Youth Showed a Steeper Poverty-Adversity Slope
The analytic sample came from the Adolescent Brain Cognitive Development Study, a US community cohort recruited across 21 sites. At baseline, the children averaged 9.92 years old, 48.4% were female, and 1,492 children (14.8%) met the federal-poverty-threshold definition of poverty exposure.
Researchers built a cumulative early-life adversity score from indicators covering prenatal exposure, child health and trauma, family functioning, peer adversity, school context, and neighborhood context. Behavioral problems were measured with the Child Behavior Checklist (CBCL) Total Problems score, a parent-rated scale that summarizes broad emotional and behavioral difficulty.
Poverty-exposed youth had higher adversity burden than higher-income peers, with a large group difference (Cohen’s d = 0.85), and higher baseline behavioral problems, with a smaller difference (Cohen’s d = 0.26). The stronger result was slope-based: the same additional adversity burden had a larger association with CBCL problems under poverty.
Baseline slope difference: cumulative adversity was more strongly tied to CBCL Total Problems in poverty-exposed youth than in higher-income youth (Delta beta = 0.088; SE = 0.020; P < .001).
Longitudinal persistence: the poverty-amplified slope was still visible at later waves, including wave 4 (Delta beta = 0.061; SE = 0.022; PFDR < .01).
Stop-Signal fMRI Split Poverty-Exposed Youth Into 2 Profiles
The fMRI analysis focused on 7,401 youth with usable stop-signal task imaging. A stop-signal task asks participants to respond quickly on most trials but cancel the response when a stop cue appears; it is a standard way to probe response inhibition and control-network recruitment.
Hu et al. used 178 brain-region activation estimates from the correct-stop vs. correct-go contrast. The researchers then applied HYDRA, a semi-supervised clustering method that identifies subgroups inside one population by comparing them against a reference group. Here, the method looked for neurofunctional subtypes among poverty-exposed youth relative to higher-income youth.
- Subtype-1: higher activation across distributed stop-signal task regions relative to higher-income youth.
- Subtype-2: lower activation across distributed stop-signal task regions relative to higher-income youth.
- Baseline comparability: the 2 poverty subtypes did not significantly differ in demographics, baseline adversity exposure, baseline CBCL scores, or cognitive performance.
That last point is important because it keeps the subtype result from collapsing into a simple “one group was already worse” explanation. The subtypes looked similar on measured non-neural characteristics at baseline but diverged in how adversity burden translated into later behavioral problems.
Subtype-1 Had the Highest Adversity-Behavioral-Problems Slope
Subtype-1 showed the clearest high-vulnerability pattern. In higher-income youth, the cumulative-adversity slope for CBCL Total Problems was beta = 0.384. In poverty subtype-1, the slope was beta = 0.533. The between-group difference was Delta beta = 0.149 (SE = 0.033; P < .001).
Subtype-2 looked different. Its slope was beta = 0.433, which was numerically higher than the higher-income slope but not statistically confirmed as different from it (Delta beta = 0.049; SE = 0.033; P = .135). Point estimates still leaned toward some poverty-linked elevation, but the formal contrast did not support the same amplified-vulnerability claim seen in subtype-1.
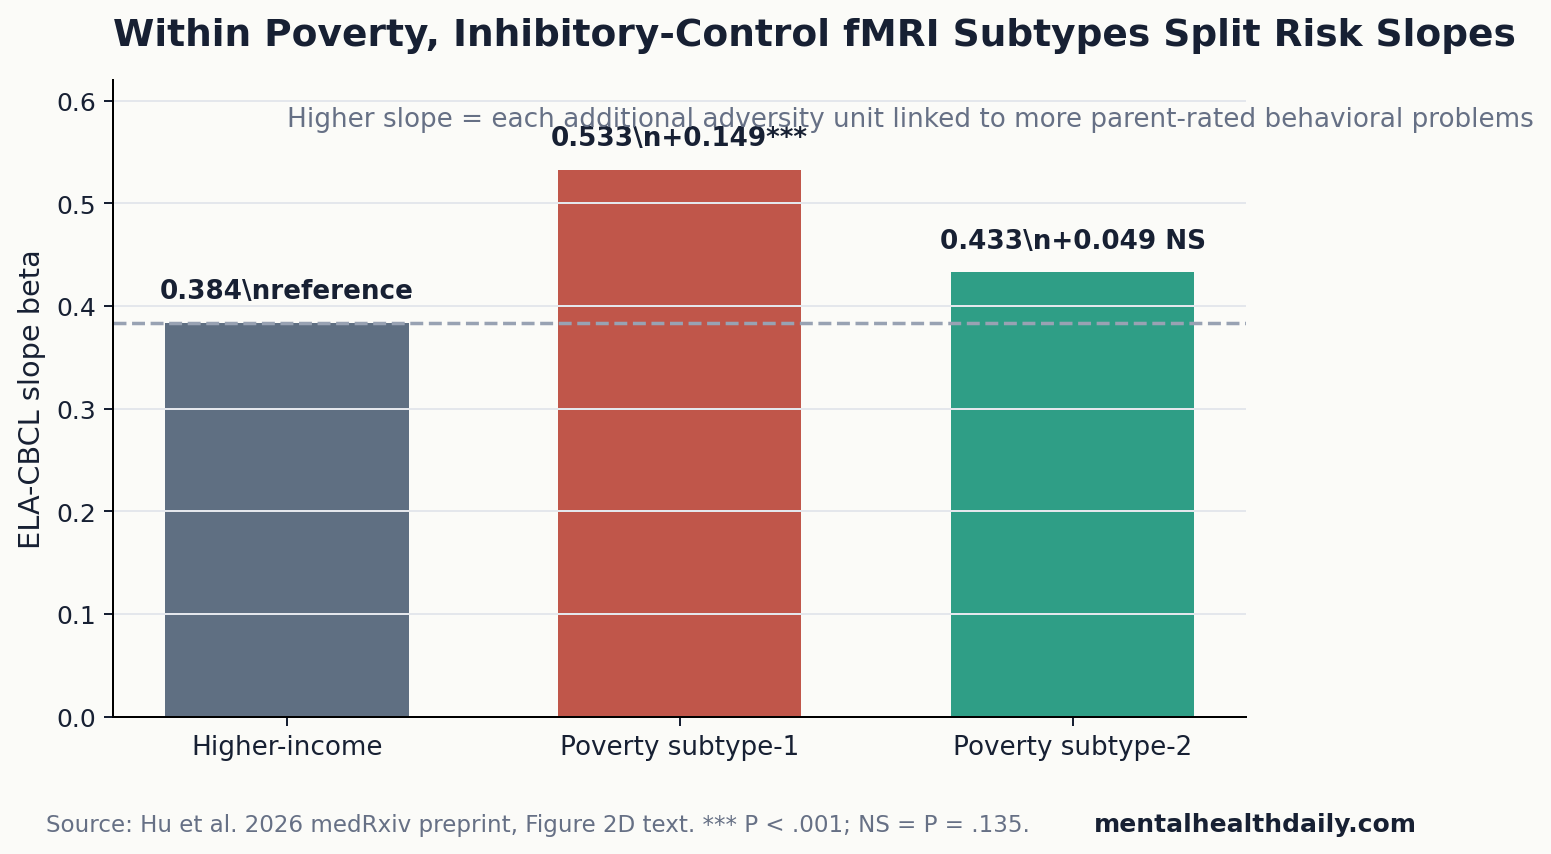
Practical interpretation: the subtype result is not that poverty subtype-2 was untouched by adversity. It is that the adversity-to-behavioral-problems slope in subtype-2 was much closer to the higher-income comparison group, while subtype-1 showed a clearly steeper slope.
High Everyday Inhibitory Control Further Buffered Subtype-2
Temperamental inhibitory control added a behavioral layer to the fMRI split. In the full sample, higher caregiver-rated inhibitory control predicted weaker adversity-linked vulnerability at follow-up. The wave-3 cumulative-adversity-by-temperament coefficient was beta = −0.030 (P < .001), and the wave-4 coefficient was beta = −0.024 (P = .005).
Within poverty-exposed youth, temperament and fMRI subtype worked together. The subtype-by-adversity-by-temperament interaction was significant at wave 3 (F(2,6590) = 3.360; P = .035) and wave 4 (F(2,5829.4) = 3.017; P = .049).
The most buffered profile appeared in subtype-2 youth with high temperamental inhibitory control. In that subgroup, cumulative adversity no longer significantly predicted later behavioral problems at wave 3 (beta = 0.088; PFDR = .362) or wave 4 (beta = 0.079; PFDR = .424). All other poverty-exposed temperament/subtype combinations retained significant adversity-linked behavioral risk.
Molecular Mapping Was Exploratory, Not a Clinical Mechanism
Hu et al. also mapped subtype-specific activation patterns against PET receptor atlases and Allen Human Brain Atlas gene-expression gradients. This step was exploratory; it tested spatial correspondence between brain maps, not whether a neurotransmitter system caused resilience or vulnerability.
Subtype-1, the higher-activation and higher-vulnerability profile, showed modest spatial correspondence with monoaminergic receptor maps: serotonergic 5-HT1A (r = .202; Pspin = .048) and dopaminergic D2 distributions (D21 r = .177; Pspin = .050; D23 r = .209; Pspin = .042). Subtype-2 did not show significant receptor/transporter correspondence.
Transcriptomic mapping pointed the other way. Partial least squares analysis found significant covariance for subtype-2 (variance explained = 38.6%; Pspin = .024), with enrichment for glial and precursor cell classes including astrocytes, oligodendrocytes, microglia, and oligodendrocyte precursor cells. This is hypothesis-generating biology, not a treatment map.
Resilience Under Poverty Was a Lower Slope, Not a Clean Escape
Resilience is easy to overstate when a study finds a buffered subgroup.
Calibration: Hu et al. did not show that self-control erased poverty, that fMRI can find resilient children in clinics, or that individual children should be sorted by brain activation. The stronger claim is narrower: in a large cohort, poverty exposure amplified adversity-linked behavioral risk, and distributed inhibitory-control profiles separated higher- and lower-vulnerability pathways within poverty-exposed youth.
That reading fits adjacent evidence. Udalova et al. linked lower family income to worse US child and adolescent health outcomes. VanBronkhorst et al. showed that sociocultural risk and resilience factors modify how adverse childhood experiences relate to youth mental health. Johnson et al. found that early-life threat and deprivation are associated with executive-function differences in children and adolescents.
Intervention evidence also keeps the result from becoming fatalistic. Neville et al. reported that a family-based training program improved neurocognitive function and behavior in lower-socioeconomic-status preschoolers. That does not prove the Hu et al. fMRI subtypes are trainable, but it supports the broader idea that regulatory systems are not fixed traits.
Evidence-strength note: this was a medRxiv preprint and an observational cohort analysis. It can show that poverty, adversity burden, inhibitory-control profiles, temperament, and later behavioral problems travel together over time. It cannot prove causal protection, validate fMRI subtyping for individual children, or replace social policy with self-regulation training.
Policy read: the safest use is combined support: reduce material stressors while strengthening everyday regulatory skills in families, schools, and clinical prevention programs.
Questions About Childhood Poverty, Inhibitory Control, and Resilience
Does this mean inhibitory control protects children from poverty?
No. High temperamental inhibitory control and the subtype-2 fMRI profile marked a lower adversity-risk slope within poverty-exposed youth. They did not remove poverty exposure, structural hardship, or all behavioral risk.
Can stop-signal task fMRI identify resilient children clinically?
No. The fMRI subtypes were research clusters in a large cohort. They are not clinical scans, diagnostic labels, or screening tools for individual children.
Why focus on slopes instead of average symptom scores?
A slope shows how strongly each added adversity unit is tied to behavioral problems. That can reveal vulnerability even when 2 groups have similar symptom levels at one time point.
What should prevention research take from this?
Prevention studies should measure poverty context, cumulative adversity, everyday inhibitory control, and mental-health trajectories together. The Hu et al. result suggests that the same poverty exposure can contain separable risk pathways, which matters when designing targeted supports.
References
- Hu B, Yang T, Hu Y, et al. Neurobehavioral Profiles of Inhibitory-Control Stratify Vulnerability and Resilience under Childhood Poverty. medRxiv. 2026. https://doi.org/10.64898/2026.04.18.26350994
- Udalova V, Bhatia V, Polyakova M. Association of Family Income With Morbidity and Mortality Among US Lower-Income Children and Adolescents. JAMA. 2022;328(24):2422-2430. https://doi.org/10.1001/jama.2022.22778
- VanBronkhorst SB, Abraham E, Dambreville R, et al. Sociocultural Risk and Resilience in the Context of Adverse Childhood Experiences. JAMA Psychiatry. 2023. https://doi.org/10.1001/jamapsychiatry.2023.4900
- Johnson D, Policelli J, Li M, et al. Associations of Early-Life Threat and Deprivation With Executive Functioning in Childhood and Adolescence: A Systematic Review and Meta-analysis. JAMA Pediatrics. 2021;175(11):e212511. https://doi.org/10.1001/jamapediatrics.2021.2511
- Neville HJ, Stevens C, Pakulak E, et al. Family-based training program improves brain function, cognition, and behavior in lower socioeconomic status preschoolers. PNAS. 2013;110(29):12138-12143. https://doi.org/10.1073/pnas.1304437110
- Gee DG. Early Adversity and Development: Parsing Heterogeneity and Identifying Pathways of Risk and Resilience. American Journal of Psychiatry. 2021;178(11):998-1013. https://doi.org/10.1176/appi.ajp.2021.21090944
Leave a Reply