⏱ 9 min read
A 2026 prospective birth-cohort study in southern China linked mean cord-blood lead of 15.30 μg/L to lower infant neurodevelopmental scores across all 5 Ages and Stages Questionnaire domains, even though only 1.13% of samples exceeded 50 μg/L.1 A second finding was mechanistic: part of the lead-development association statistically ran through FAM50B/PTCHD3 DNA methylation, an epigenetic signal tied to neuronal function and synaptic conduction.
Research Highlights
- Low exposure still tracked development: mean cord-blood lead was 15.30 μg/L, yet lead was the only measured metal consistently associated with all 5 infant developmental domains.1
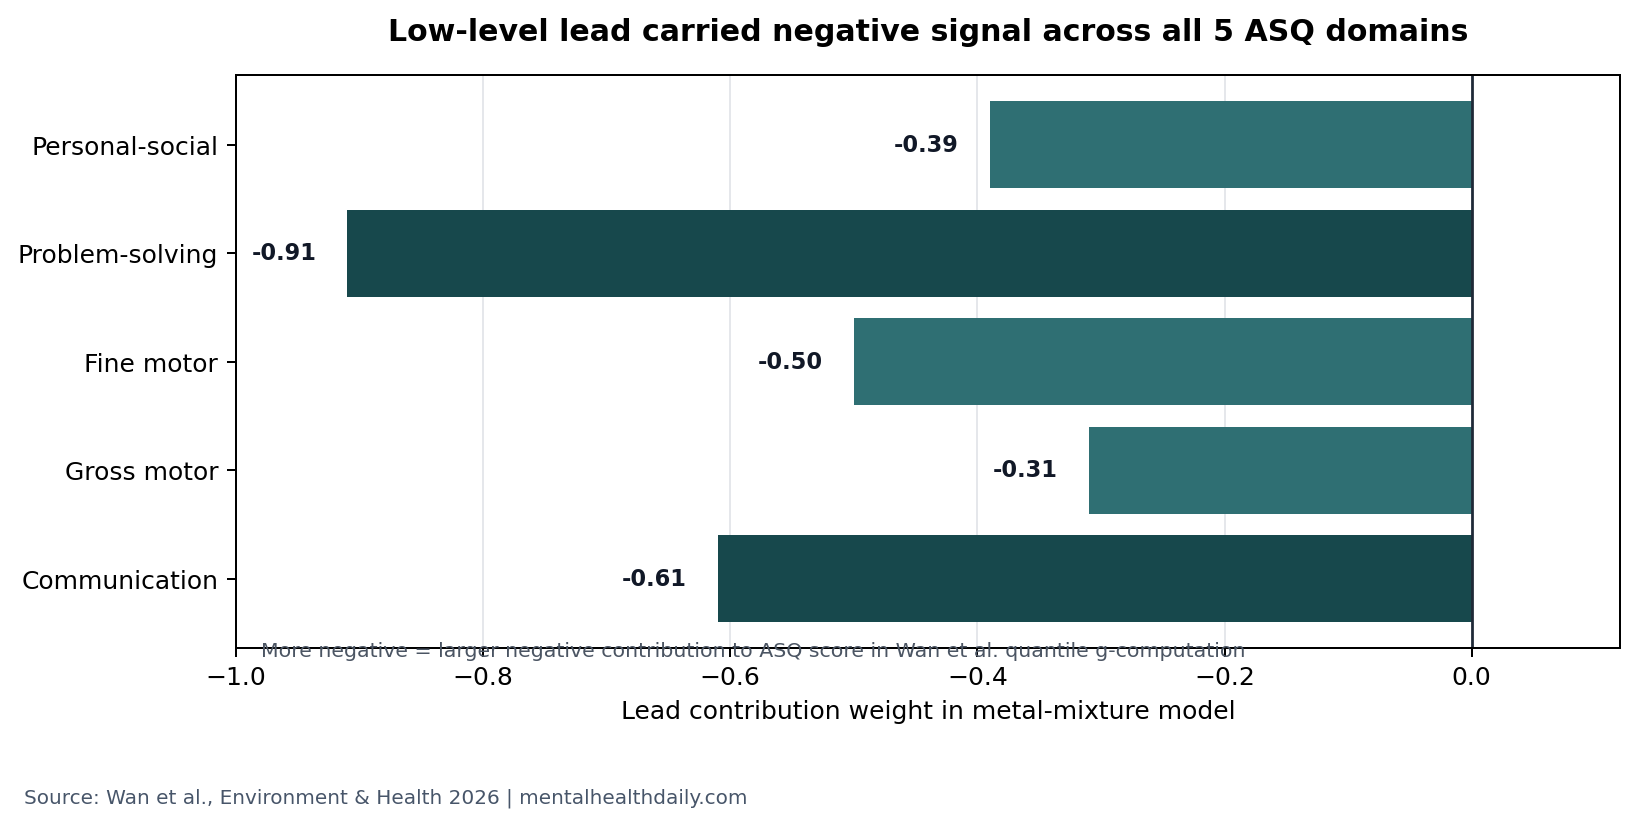
- Lead dominated the mixture signal: quantile g-computation gave lead negative contribution weights for communication, gross motor, fine motor, problem-solving, and personal-social scores.1
- Four CpG sites carried mediation signal: FAM50B_1_9 and 3 PTCHD3 sites statistically mediated parts of the lead association with motor, problem-solving, and personal-social scores.1
- Prediction was moderate, not clinical-ready: a random forest model using methylation markers reached 77% accuracy and 87% AUC internally, then 72% accuracy and 75% AUC in the held-out test set.1
- The 353-child design strengthens prevention logic: the evidence supports minimizing lead exposure rather than waiting for a high blood-lead threshold, but it does not prove causality or validate a diagnostic test.
DNA methylation is a chemical tag on DNA that can change gene activity without changing the gene sequence. In environmental neurodevelopment research, methylation is useful because it can sit between exposure and outcome: lead exposure may shift methylation at certain sites, and those methylation differences may correlate with later developmental scores.
Wan et al. studied 353 mother-infant pairs from the Maoming Birth Cohort. Cord blood was collected at delivery, 27 metals were measured, and infants were followed from 3 to 36 months with the Ages and Stages Questionnaire, third edition (ASQ-3), a parent-report developmental screen covering communication, gross motor, fine motor, problem-solving, and personal-social development.1
15.30 μg/L Cord-Blood Lead Was Not Reassuring
The study population was not a high-lead industrial cohort. Mean cord-blood lead was 15.30 μg/L, and only 1.13% of samples exceeded 50 μg/L.1
Exposure context: that matters because many policy thresholds and clinical reflexes still treat higher values as the obvious concern. Wan et al. tested a more uncomfortable question: whether lead around this lower range still carries measurable neurodevelopmental signal during infancy.
The answer was directionally clear. In mixed-effect models, lead showed a consistent negative association across all 5 ASQ-3 domains. Tin, silicon, and uranium appeared in selected domains, but lead was the only metal that tracked the full developmental profile.1
Developmental domains: communication captures early language and social response; gross motor captures large body movements; fine motor captures hand and finger control; problem-solving captures early cognitive task handling; personal-social scores capture self-help and social interaction. A lead signal across all 5 domains is broader than a narrow motor or language finding.
Lead Was the Main Negative Metal in the Mixture Models
Single-metal models can mislead when children are exposed to mixtures. Wan et al. used quantile g-computation and Bayesian kernel machine regression to ask which metals contributed most when the exposure pattern was analyzed together.1
Mixture-model read: lead carried negative contribution weights for communication (−0.61), gross motor (−0.31), fine motor (−0.50), problem-solving (−0.91), and personal-social behavior (−0.39). The strongest lead weight was problem-solving, followed by communication and fine motor skills.
Bayesian kernel machine regression produced the same practical read: higher lead was associated with lower ASQ indicators, especially problem-solving, fine motor, and gross motor scores, while dose-response curves were linear or approximately linear for several domains.1
FAM50B/PTCHD3 Methylation Carried Part of the Lead Signal
The methylation analysis narrowed the finding from a broad exposure association to a candidate biological pathway. Elevated blood lead was associated with lower methylation across several regions, with FAM50B and PTCHD3 standing out because prior work had linked these fragments to IQ and neuronal function.1
CpG sites are DNA locations where a cytosine base sits next to a guanine base; methylation at these sites can influence gene regulation. Wan et al. initially found 37 lead-associated CpG sites and then identified 23 significant sites after multiple linear regression: 8 in FAM50B, 10 in PTCHD3, 2 in CCDC144B, and 3 in LOC283177.1
Mediation analysis then selected 4 CpG sites as the most important bridges between cord-blood lead and developmental scores:
- FAM50B_1_9: mediated associations between lead and fine motor plus personal-social scores, with a 2.99% mediation contribution.
- PTCHD3_1: mediated gross motor, personal-social, fine motor, and problem-solving associations, with domain contributions ranging from 4.46% to 6.43%.
- PTCHD3_9: mediated gross motor and problem-solving associations, with 5.70% contribution in each domain.
- PTCHD3_7: mediated problem-solving only, with a 5.68% contribution.
Those percentages are not huge, and they should not be read as a full mechanism. They are still useful because they identify a measurable molecular layer where low-level lead exposure and early development may connect.
Random Forest Prediction Was Useful but Not Diagnostic
Wan et al. also tested whether methylation markers could classify developmental status across the 0 to 3 year age range. A random forest model performed best among 10 tested algorithms, reaching 77% accuracy and 87% area under the receiver operating curve internally, then 72% accuracy and 75% AUC in an external test split.1
Interpretation: that is promising biomarker performance for a research cohort, not enough for clinical screening. The model used 280 training cases and 73 held-out test cases, so even modest overfitting or cohort-specific structure could move the numbers.
Models with DNA methylation data outperformed covariate-only models, with reported gains of 42% to 47% in accuracy and 34% to 39% in AUC for the random forest model.1 That strengthens the case that methylation is adding signal rather than merely restating demographic risk.
Earlier Lead Studies Also Point Below High-Toxicity Ranges
Wan et al. did not arrive in an empty literature. Lanphear et al. pooled international child data and found that IQ losses were visible across low blood-lead ranges, with no obvious safe threshold.2 The Wan study extends that prevention logic into cord-blood exposure and repeated infant developmental screening.
Attention and behavior data point in the same direction. A South Korean study linked blood lead around 18.1 μg/L to attention-deficit/hyperactivity symptom domains in school-age children, while a Mexican study linked blood lead around 34 μg/L to attention problems in children aged 6 to 13 years.3,4
What is new here: the 2026 cohort focused on earlier development, lower mean exposure, metal mixtures, and methylation mediation. The outcome was not IQ or diagnosed attention-deficit/hyperactivity disorder; it was broad ASQ-3 developmental performance in infancy.
What the Study Can and Cannot Prove
This is a prospective cohort, which is stronger than a one-time cross-sectional analysis because exposure was measured in cord blood before the developmental follow-up. It still cannot prove that lead caused the lower ASQ-3 scores or that FAM50B/PTCHD3 methylation caused developmental impairment.
Evidence-strength note: observational mediation analysis can suggest a pathway, but it cannot isolate lead from every correlated exposure, nutritional factor, social variable, or unmeasured environmental pollutant. Wan et al. adjusted for child sex, maternal education and occupation, household income, parental smoking and alcohol use, and additional sensitivity covariates, but residual confounding remains possible.1
Generalizability is also limited. The cohort came from one hospital in southern China, used ASQ-3 rather than a full diagnostic developmental battery, and measured cord-blood lead rather than lifetime exposure. Cord blood is valuable for in utero exposure, but lead exposure after birth can change the trajectory.
The Practical Read Is Prevention, Not Testing
The most defensible conclusion is preventive: low lead is still lead. A mean cord-blood level of 15.30 μg/L was not biologically silent in this cohort, and no result in the paper creates a reassuring cutoff below which infant neurodevelopment is protected.
Clinical translation: FAM50B/PTCHD3 methylation is a research biomarker, not a consumer test. Parents and clinicians should not use methylation status to diagnose developmental delay, decide treatment, or rank individual children by lead vulnerability.
The public-health implication is more direct. Housing, water, dust, soil, industrial emissions, imported products, and occupational take-home exposure remain the relevant prevention targets. Once lead reaches a fetus or infant, the downstream biology may be partly measurable; the better intervention is keeping exposure as low as possible before there is anything to measure.
Questions About Low-Level Lead and Infant Development
Was 15.30 μg/L a high blood-lead level?
No. Wan et al. described the cohort as relatively low exposure, with only 1.13% of samples above 50 μg/L. The important point is that measurable neurodevelopmental associations still appeared at that lower mean exposure.1
Does this prove lead caused developmental delay?
No. The prospective timing, mixture modeling, and mediation analysis make the result stronger than a simple association, but the study remains observational. It supports risk reduction, not individual causal diagnosis.
Why did Wan et al. focus on FAM50B and PTCHD3?
They are gene regions whose DNA methylation patterns have been linked in prior work to neuronal function, synaptic conduction, and child cognitive outcomes. In this study, methylation at specific FAM50B/PTCHD3 CpG sites partly mediated the lead-development association.1
Should children be tested for these methylation markers?
Not clinically. The random forest model was promising for research, but a 353-person cohort is not enough to turn FAM50B/PTCHD3 methylation into a diagnostic screen.
Which developmental domain looked most sensitive?
In the mixture model, the largest negative lead contribution weight was for problem-solving (−0.91), followed by communication (−0.61) and fine motor (−0.50). Lead still showed negative contribution weights across all 5 ASQ domains.1
What is the safest interpretation for parents?
Avoid preventable lead exposure wherever possible, keep routine pediatric developmental screening, and treat any elevated lead result as a prevention and remediation issue rather than waiting for symptoms.
References
- Wan C, Ma H, Zeng X, et al. DNA methylation of FAM50B/PTCHD3 mediates the relationships between low blood lead exposure and neurobehavioral development of 0-3 aged infants: a prospective birth cohort study in southern China. Environment & Health. 2026;4:742-753. doi:10.1021/envhealth.5c00459
- Lanphear BP, Hornung R, Khoury J, et al. Low-level environmental lead exposure and children’s intellectual function: an international pooled analysis. Environmental Health Perspectives. 2005;113(7):894-899. doi:10.1289/ehp.7688
- Kim S, Arora M, Fernandez C, et al. Lead, mercury, and cadmium exposure and attention-deficit/hyperactivity disorder symptom domains in a community sample of South Korean school-age children. Environmental Health Perspectives. 2015;123(3):271-276. doi:10.1289/ehp.1307420
- Huang S, Hu H, Sanchez BN, et al. Childhood blood lead levels and symptoms of attention deficit hyperactivity disorder: a cross-sectional study of Mexican children. Environmental Health Perspectives. 2016;124(6):868-874. doi:10.1289/ehp.1510067
- GBD 2019 Risk Factors Collaborators. Global burden of 87 risk factors in 204 countries and territories, 1990-2019: a systematic analysis for the Global Burden of Disease Study 2019. Lancet. 2020;396(10258):1223-1249. doi:10.1016/S0140-6736(20)30752-2
Leave a Reply