
Main
Mental disorders remain the leading cause of poor quality of life1, with their disease burden contributing to substantial economic loss, years lived with disability and premature mortality2. Among the broad spectrum of mental disorders, depression and anxiety are particularly prevalent and show distinct patterns across gender/sex categories. Women report higher rates of depression and anxiety in all age groups and settings, which is suggested to be influenced by both biological and social factors3,4. Men, in contrast, reported lower levels of depression but experience higher suicide rates, which may be linked to narrow gender norms, men delaying help-seeking and their depressive symptoms not being recognized5,6,7. Furthermore, individuals who do not conform to stereotypical gender norms are at elevated risk for a range of mental disorders, an effect hypothesized to be related to marginalization and discrimination8,9. Hence, sex and gender are widely recognized as key determinants of mental health8. Sex refers to biological characteristics, such as genes or genitals10, whereas gender refers to a social construct with multiple dimensions, including identity, expression, beliefs, societal structures and institutions11,12. However, researchers from different disciplines increasingly emphasize the complex conceptual and empirical entanglement of gender and sex13,14,15.
In psychological literature, theories such as the minority stress model or gender role conflict theory propose that individuals who do not conform to the expected gender norms experience lower levels of belonging and more self-criticism7,9,16. They limit their self-expression through self-imposed restrictions to conform more strongly to context-specific gender norms, starting from developmental phases in childhood and adolescence and continuing across the life course12,16,17.
To understand gender norms better, it is helpful to turn to the sociological literature11, where gender is conceptualized as a social structure relating to institutional practices and cultures (the macro level) and to broader social interactions that operate across different levels of society, ultimately shaping the context within which an individual’s perceptions of gender (the micro level) are constructed. Hence, norms can be seen to influence how people are expected to act or behave, and they are judged in relation to these expectations11.
Both contemporary sociology and psychology challenge conventional binary measures of gender (woman or man) that conflict with the multifaceted conceptualization of gender7,12. Femininity and masculinity can be seen as socially constructed configurations of gender norms, behaviors and practices associated with women and men, respectively18,19,20. A long-standing line of psychological research pioneered the measurement of stereotypically feminine and masculine personality traits as two independent dimensions, allowing individuals to be characterized by varying combinations of femininity and masculinity21. In response to conceptual and methodological criticisms of the narrow, predefined focus of earlier measures, gradational self-ratings of femininity and masculinity have been developed for large-scale surveys to enable more flexible self-reports and to capture greater variation across diverse populations18,22.
When applying the gradational measurements of femininity and masculinity in a non-representative, primarily healthy adult US sample, results indicated that a substantial proportion of individuals whose sex and gender align experienced both a degree of masculinity and a degree of femininity18. Thus, gradational femininity and masculinity scales reflect respondents’ assessments of the extent to which they conform to or deviate from the perceived gender norms18,23. In a recent meta-analytic review4 of 58 studies published between 1978 and 2021, masculinity emerged as a protective factor for depression. A weak but significant negative association between femininity and depression was observed in specific subgroups (for example, women and college students), and androgynous individuals reported the lowest levels of depressive symptoms compared with masculine, feminine and undifferentiated groups, particularly in contexts with higher life expectancy and per capita income. In terms of gender non-conformity, a recent meta-analysis9 found that higher rates of gender non-conformity were related to higher rates of depressive symptoms. Using femininity and masculinity self-ratings, a non-representative study in the USA observed that individuals with less conforming gender identities reported worse self-rated health24. One recent comparative study25 based on non-representative samples across 15 countries found that gender non-conformity was less strongly associated with lower self-esteem in countries with higher societal gender equality. These findings point to the importance of further cross-national comparisons based on more representative samples to better understand the moderating role of contextual gender equality.
Thus, following this line of research, we draw on gradational scales of femininity and masculinity to construct a continuous self-perceived gender conformity scale in nationally representative datasets for 40,156 individuals across 194 regions in 24 countries in Europe (Austria, Belgium, Croatia, Cyprus, Finland, France, Germany, Greece, Hungary, Iceland, Ireland, Italy, Lithuania, the Netherlands, Norway, Poland, Portugal, Serbia, Slovak Republic, Slovenia, Spain, Sweden, Switzerland and the UK).
Although the European Union (EU) has encouraged all its member states to implement policies to support more gender-equal societies26, substantial variations in gender inequalities in economic, political and cultural resources persist across countries and regions26,27,28. For example, compared with men, women’s labor market participation and political representation remain lower in most countries29. Both domains are reflective of the gender regime, which can be defined as institutional-level structures that contribute to maintaining or changing gender norms19,30. Gender regimes that are more supportive of equal rights and opportunities for women and for gender and sexual minorities tend to emerge in contexts that were backed by democracy and pro-feminist state institutions31. For example, gender equality in political representation and public support for equal rights, both between women and men and for gender and sexual minorities, is considerably higher in the Nordic countries than in many Southern and Eastern European countries. Furthermore, there is considerable within-country variation31. Hence, in this study, we take the subnational regional variation in gender equality into account by drawing on sociological theories of gender regimes and social structures11,26 and constructing a regional gender equality index covering women’s share in politics, attitudes toward gender equality, female employment rates and attitudes toward homosexuality, all at the regional level.
On the basis of the previously mentioned psychological and sociological theories and literature, we expect that individuals with lower self-perceived conformity to gender norms experience more depressive symptoms (hypothesis 1). We expect this relationship even after accounting for widely documented differences between female and male participants3,32.
Furthermore, we expect that contexts with greater gender equality, captured with women’s access to economic and political resources, and cultural support for gender equality and homosexuality, allow for a less constrained self-expression and an elevated feeling of belonging, especially for less conforming and non-conforming individuals. This means that higher levels of gender equality, as experienced in many Northern European regions, may help reduce depressive symptoms among individuals who perceive themselves as not conforming to traditional gender norms. In contrast, the depressive symptom load is assumed to be higher in more structurally and normatively restrictive contexts, such as in many regions in Southern and Eastern Europe. Thus, we expect regional gender equality to moderate the negative relationship between gender conformity and depressive symptoms (hypothesis 2).
Results
In our sample of 40,156 individuals across 194 European subnational regions, defined as Nomenclature of Territorial Units for Statistics (NUTS), the self-perceived gender conformity score was on average 4.4 (s.d. = 2.12), with a median of 5 and a range from −6 (strongly conforming to the norms linked with the other sex category) to 6 (strongly conforming to norms associated with one’s sex category). The self-perceived gender conformity had the lowest average in Finland (2.9, s.d. = 2.2), Norway (3.3, s.d. = 2.0) and Sweden (3.4, s.d. = 2.2). At the other end of the spectrum, respondents in Hungary, Slovakia and Poland reported the highest average gender conformity at 4.9 (s.d. = 2.0), 5.1 (s.d. = 2.0) and 5.3 (s.d. = 1.5), respectively. The distribution is therefore generally skewed toward conformity, even in the most gender-equal societies. In pairwise correlations, self-perceived gender conformity correlated only weakly with age, years of education, depressive symptoms, hours of care work and feeling of income (range of r = −0.14 to 0.03).
In the first multilevel regression model (Table 1), higher self-perceived gender conformity (by 1 point) relates significantly to 0.25 points fewer depressive symptoms (on a scale from 0 to 24). Self-perceived gender conformity remains highly significant despite the significant differences between women and men, with women on average reporting 0.61 points more depressive symptoms compared with men. Furthermore, individuals living in regions with 1 s.d. higher gender equality report 0.22 points fewer depressive symptoms. This accumulates to a difference of 0.88 depressive symptoms points between the most egalitarian Northern European regions (mean + 2 s.d.), such as regions in Sweden and Iceland, and the most traditional regions in Southeastern Europe (mean − 2 s.d.), such as regions in Greece (see Fig. 1 for regional distribution of the gender equality index).
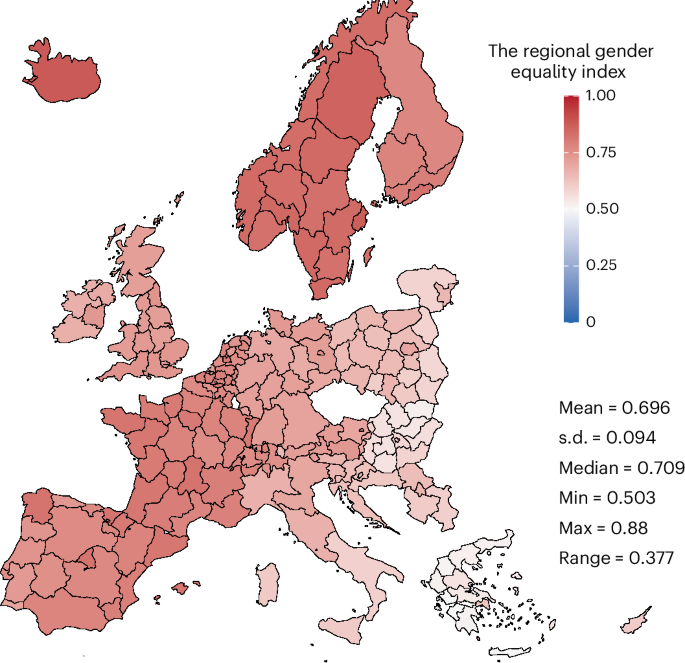
This index was constructed based on the percentage of women in politics, gender equality attitudes, female employment rates and attitudes toward homosexuality, all on the regional level.
To explore the moderating role of regional gender equality, the second model in Table 2 includes a two-way interaction between self-perceived gender conformity and the regional gender equality index. The significant interaction effect indicates that individuals who conform less to gender norms (by 1 point), for example in Eastern European regions such as Poland or Lithuania, where levels of gender equality are about 1 s.d. lower than in average regions, report approximately 0.34 points higher levels of depressive symptoms. By contrast, in the most gender-equal regions in Northern Europe or France, less gender-conforming individuals do not report more frequent depressive symptoms (Fig. 2). This applies similarly to women and men, as shown by tests of a three-way interaction between self-perceived gender conformity, the gender equality index and interviewer-coded sex/gender. This interaction with the sex/gender category did not reach statistical significance (Supplementary Table 1c).
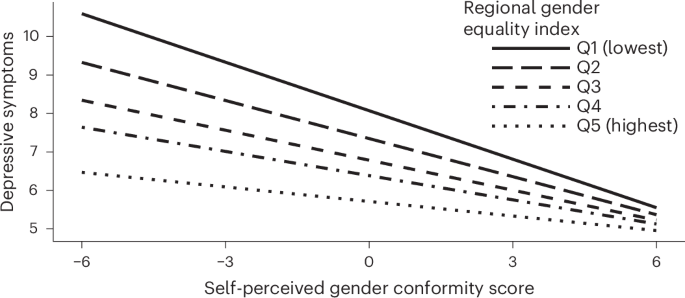
The self-perceived gender conformity score is multiplied by the regional gender equality index. The adjusted multilevel regression model has two levels: an individual level and a regional level. Depressive symptoms were measured with the CES-D 8. The self-perceived gender conformity score is mean-centered in relation to the regional average. Q1–5, lowest to highest quintile.
Hence, on the basis of the models with the continuous self-perceived gender conformity measure, individuals with lower self-perceived gender conformity report more depressive symptoms, which is in line with hypothesis 1. However, this relationship is stronger in European regions with lower levels of gender equality, supporting hypothesis 2. This indicates that individuals who do not conform to gender norms experience emphasized mental health challenges in gender-unequal settings.
Self-perceived gender conformity categories
We also created self-perceived gender conformity categories based on the interviewer-coded gender category (female or male), self-identified gender category (woman, man or other) and the continuous self-perceived gender conformity score to explore nonlinear relationships between varying levels of gender conformity and depressive symptoms. Those in the non-conforming category have more years of education, are more likely to have a migration background and are less often partnered.
Compared with more conforming women, women who conform less to perceived gender norms are younger, less frequently partnered and less frequently living with children under 18 years old in the household. Lastly, among men, those conforming more to gender norms completed fewer years of education and are more often partnered than less conforming men (for further information, see Supplementary Table 2). We also observe a difference in average depressive symptoms, with those in the non-conforming category on average reporting the highest levels of depressive symptoms (6.8 points) and more conforming men the lowest (4.8 points).
Table 3 shows multilevel regression models with the self-perceived gender conformity categories as the main independent variable and more conforming women as the reference category. Individuals in the non-conforming category reported 1.24 points more depressive symptoms compared with more conforming women. For women and men, less conforming individuals reported about 0.8 points more depressive symptoms than more conforming individuals. These results align with the models based on the continuous gender conformity variable in Table 1. The differences between women and men are also of similar magnitude as in Table 1, with more conforming men reporting 0.62 points lower depressive symptoms than more conforming women.
Including a two-way interaction between the self-perceived gender conformity categories and the regional gender equality index (Table 3) reveals that the gap between individuals in the non-conforming category and more conforming women is 0.5 points larger in regions with 1 s.d. lower levels of gender equality. Thus, the gap in depressive symptoms between these 2 conformity groups amounts to 2.4 points in the least gender-equal contexts in Europe, such as most of Greece and Eastern Slovakia. By contrast, differences in depressive symptoms between all conformity groups are small across all groups (between 0.19 and 0.59) and often non-significant in highly gender-equal settings, such as Iceland or Sweden. More conforming men consistently show the lowest level of depressive symptoms across all contexts (Fig. 3).
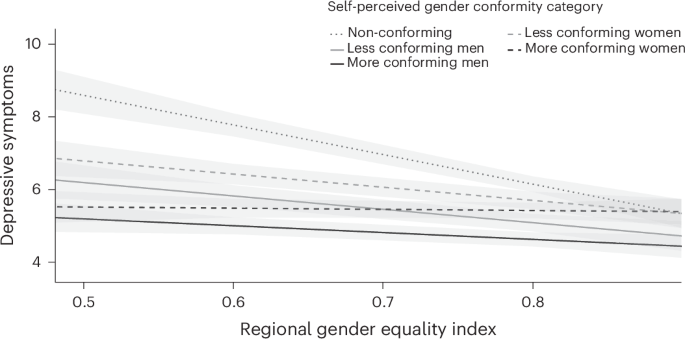
Self-perceived gender conformity categories multiplied by the regional gender equality index. The adjusted multilevel regression model has two levels: an individual level and a regional level. Depressive symptoms were measured with the CES-D 8. Shaded areas indicate the 95% confidence intervals associated with each line.
The results from the analysis of the categorical gender non-conformity variable align with those of the continuous measures, supporting both hypotheses: in regions with low gender equality, such as Eastern and Southern Europe, the disparities in depressive symptoms between non- and less gender-conforming individuals compared with more gender-conforming individuals are amplified. In particular, the results point to strongly elevated risks of depressive symptoms for non-conforming individuals in European regions with average to low levels of gender equality.
Discussion
Recognizing the complexity of gender and its entanglement with sex, this study explored how self-perceived gender (non-)conformity related to depressive symptoms within the broader context of gender regimes across 194 regions, nested within 24 countries in Europe. We examined the interdependence with macro-level gender regime characteristics by considering regional variation in gender equality in terms of women’s share in politics, female employment rate, attitudinal support for gender equality and support for homosexuality. As hypothesized, our findings showed that individuals with lower self-perceived gender conformity, based on femininity and masculinity self-ratings, reported higher levels of depressive symptoms. This relationship was stronger in regions with lower levels of gender equality. Our results are broadly in line with previous non-representative studies for self-rated general health in the USA24 and for self-esteem in 15 European countries25. Furthermore, by distinguishing between gender conformity categories, our results indicated substantially higher levels of depressive symptoms for non-conforming individuals in European regions with average to low levels of gender equality. This finding is in line with previous studies pointing to worse mental health outcomes for gender non-conforming individuals9. In this study, the consistent significant associations with self-perceived gender conformity across variable and model specifications suggest that a gradational measure of self-rated femininity and masculinity can complement conventional measures of sex or gender categories in a meaningful way and be beneficial for large-scale representative studies on mental health.
In line with previous research3,32, we found that women consistently reported higher levels of depressive symptoms than men. Different explanations have been proposed, including biological mechanisms related to hormonal fluctuations across one’s lifespan3 and social processes, such as women exhibiting greater acceptance of depression compared with men6,33. The lowest level of depressive symptoms was reported for men who conform more strongly to gender norms. This could reflect societal norms that discourage emotional expression among men, as such expressions are perceived as incongruent with masculine ideals or norms4,34. Men may also delay help-seeking due to stigma or a lack of mental health awareness35. In addition, depression in men may manifest through externalizing behaviors, such as substance use or impulsivity, rather than through emotional symptoms5.
Our results showed that less conforming individuals show lower levels of depressive symptoms in more gender-equal societies, while controlling for other risk factors (such as income, education or age) and differences in regional economic development. This aligns closely with previous findings of societal gender equality moderating the associations of gender conformity with self-esteem25. This may be attributed to more liberal gender norms in more gender-equal contexts, reducing gender-related stress and the need to rigidly conform to traditional roles35 and enhancing perceived control over life36. Only the depressive symptom load of more conforming women did not seem to benefit from higher gender equality in the region of residence. One possible explanation may be that in more egalitarian societies, traditionally feminine personality traits, appearance-related practices and caregiving may receive less social validation compared with agentic behaviors and paid labor4,32. This may contribute to increased distress and vulnerability to depressive symptoms, despite more gender-equal access to economic and political resources. These dynamics highlight the complex relationship between gender and mental health, warranting further investigation using more causal designs.
Previous literature8,37 has emphasized that individuals with non-conforming gender identities may encounter unequal treatment in healthcare settings, not only regarding mental health but also for somatic conditions. This could further challenge the health of those with a non-conforming gender identity8. While both gender equality and depressive symptoms are multidimensional and influenced by a large range of factors, our findings indicate reduced mental health disparities in contexts with more gender-inclusive policies. Previous literature13 suggests that addressing gender issues in the training of healthcare professionals and implementing more gender-sensitive mental health policies could contribute to better mental health and mental healthcare.
Finally, several limitations should be considered when interpreting our results. First, our cross-sectional study did not establish causal relationships; therefore, confirmation through future longitudinal study designs is important. Second, linguistic and cultural variability may have influenced how survey questions were interpreted. To start, the gender sensitivity and cross-national suitability of the eight-item version of the Centre for Epidemiologic Studies Depression Scale (CES-D 8), which is our measure for depressive symptoms, have been debated38. Nevertheless, it has been tested as a valid tool for cross-national, gender-related studies in Europe33. Then, to reduce bias due to contextual differences in how concepts such as femininity and masculinity were understood, we centered the gender conformity measures at the region-specific mean. Furthermore, data collection adheres to standardized protocols, also considering cross-country differences. Still, cultural nuances in gender conceptualization may have affected the results. In addition, items capturing self-perceived gender conformity do not directly assess specific domains of gender, earlier life experiences or exposure to stigma. Thus, in future studies investigating the underlying mechanisms, more domain- and life course phase-specific measures should be considered. Lastly, it is important to note that although the measures of self-perceived gender conformity have also been used in previous studies18,23,39, further evidence is needed. Specifically, it is important to note that the non-conforming category consists of a heterogeneous group of people likely ranging from individuals who identify as non-binary to transgender, and cisgender individuals who do not feel like they conform to stereotypical feminine or masculine gender norms. In addition, in the absence of a measure of sex assigned at birth, we were only able to consider differences in the sex/gender category as coded by the interviewer and self-identified gender of respondents. Therefore, these measures were unable to identify individuals with differences in sex development, such as intersex, and are not well suited to classify some transgender individuals. As interviewer-coded sex/gender was coded after interviewers had already asked about self-identified gender, these ratings may be biased toward the respondent’s self-report. Nevertheless, we still identified 319 cases (0.8%) that showed discrepancies. This probably underestimates the true extent of discrepancies between sex assigned at birth and self-identified gender, indicating that even with this methodological limitation, meaningful differences remain detectable. Nonetheless, this study makes a valuable contribution by exploring how gradational gender (non-)conformity intersects with broader gender regimes in shaping mental health outcomes.
Conclusion
This study highlighted the link between self-perceived gender conformity and depressive symptoms across Europe while considering the regional gender equality level. Individuals who perceived themselves as conforming less to femininity and masculinity norms reported higher levels of depressive symptoms, particularly in regions with more traditional gender regimes. Our findings advance the literature on gender as a social determinant of health by highlighting the interplay of individual-level gender conformity and macro-level gender equality for mental health outcomes. Future research should apply longitudinal study designs to investigate the underlying mechanisms and explore how healthcare systems can more effectively support gender-diverse individuals, particularly in less gender-inclusive settings.
Methods
Data
We used the most recent data from the European Social Survey (ESS) 11th round40 comprising 24 countries (Austria, Belgium, Croatia, Cyprus, Finland, France, Germany, Greece, Hungary, Iceland, Ireland, Italy, Lithuania, the Netherlands, Norway, Poland, Portugal, Serbia, Slovak Republic, Slovenia, Spain, Sweden, Switzerland and the UK). This dataset was chosen because it includes a specific module on gender. The data were collected by trained interviewers in face-to-face and video interviews from September 2023 until January 2024. Individuals who are contacted by the interviewers (mostly via telephone or face to face) are assured that participation in the survey is voluntary and that they are free to choose which questions they want to answer. They are informed that they may stop the interview at any time without giving any explanation. In 7.4% of interviews, someone other than the interviewer and respondent was present during the interview. This percentage ranged from 1.8% in Finland to 10.5% in the UK.
The ESS is funded by the EU Horizon 2020 research and innovation program. All participating countries contribute to the central coordination costs and cover the cost of fieldwork and national coordination. Participants generally receive small, country-specific unconditional and conditional incentives (for example, €5–10 in cash or vouchers). The ESS European Research Infrastructure subscribes to the Declaration on Professional Ethics of the International Statistical Institute41. This study complies with these ethical regulations and was exempt from seeking specific ethical approval by the ethics committee of the University of Tübingen due to its sole use of secondary observational data.
During all phases of data collection and processing, several quality checks were in place to ensure consistent data quality across countries. The survey was originally written in English and then translated and administered in the official languages of each country. Recruitment was random at all stages, and the samples contained people older than 15 years old living in a private household. The total sample consisted of 40,156 participants, with an average age of 52 years and 54% female participants. The country subsamples ranged from 685 participants in Cyprus to 2,865 participants in Italy. To minimize bias due to differences in data collection and varying sample sizes and to achieve nationally representative country samples, weights were applied when running the analysis.
Outcome variable
The outcome of depressive symptoms was measured using the CES-D 8 (ref. 42), which includes (1) depression, (2) loneliness, (3) sadness, (4) happiness, (5) feeling that everything they did is an effort, (6) restless sleep, (7) inability to get going, and (8) enjoyment of life in the past 2 weeks. The response options range from 0 (for none or almost none of the time) to 3 (for all or almost all the time). The Cronbach’s alpha (α) value (0.82) was similar to that of a related study33. The positive items (happiness and enjoyment of life) were reversed, and the scores from all 8 items were summed (scale range, 0–24). We treated depressive symptoms as a continuous variable, with higher scores indicating higher levels of depressive symptoms33,42.
Self-perceived conformity to gender norms
The first key independent variable at the individual level was a continuous self-perceived gender conformity score based on respondents’ self-perceived femininity and masculinity, and the sex/gender category (female or male) assigned by the interviewer. The gradational scales of femininity and masculinity consisted of two items prompted as follows: (1) “Regardless of whether they were born male or female, people sometimes differ in how masculine or feminine they feel. Overall, how feminine would you say you feel?” and (2) “Overall, how masculine would you say you feel?”18. The answer options ranged from 0 (not at all) to 6 (very feminine or very masculine, respectively).
In the absence of any measure of sex assigned at birth, we draw on an interviewer-coded sex/gender category. Interviewers were asked to code the sex of the respondent as male or female without receiving specific instructions, and therefore presumably did so according to their perception of, or the appearance of, the person being interviewed. Interviewers had to code this after they had already asked a question on self-identified gender category, so interviewers most likely took respondents’ self-identified gender into account. Yet, we found 319 cases for which the interviewer-coded sex/gender category (female or male) did not match the self-identified gender category (woman or man), which may indicate transgender identification. For nearly all of these cases, we also found plausible patterns for their masculinity and femininity self-ratings that align with a transgender interpretation rather than coding errors.
Following the approach of recent studies18,23,39, we calculated a continuous self-perceived gender conformity score by subtracting masculinity from femininity for individuals coded as female by the interviewers and by subtracting femininity from masculinity for individuals coded as male by the interviewers. This way, a higher score indicates a stronger conformity to the norms associated with the sex category. The score ranges from −6 (strongly conforming to the norms linked with the other sex category) to 6 (strongly conforming to norms associated with one’s sex category). The median self-perceived gender conformity score for each region is shown in Supplementary Fig. 1. To account for cultural differences in masculinity and femininity concepts, we centered the variable at the region-specific mean for the statistical analyses, so that it reflects deviations from the region-specific average self-perceived gender conformity score. A recent validation analysis43 has shown that gradational self-perceived gender conformity correlates strongly with gendered personality traits, such as agentic and communal traits, bodily characteristics, such as height and body mass index, and with sexual orientation and parental gender socialization. In addition, it has been found to correlate with education, urban versus rural regions and partisanship23,44.
As a second key independent variable, we created a categorical self-perceived gender conformity measure to capture potential nonlinear relationships with depressive symptoms. For this, we also used the self-identified gender variable, which in the ESS survey was captured in a neutral tone using the question: “Which of the options on this card best describes you?” The participant was shown a card with the options man, woman, other or prefer not to answer. The ‘other’ category has become common practice in many representative large-scale surveys in Europe to avoid the complexity of different and fluid terms used for gender minority groups45. The option ‘prefer not to answer’ was coded as missing. Thus, we defined the non-conforming category in the categorical self-perceived gender conformity variable to contain (1) those who reported their gender category as other (n = 62), (2) those with a mismatch in the interviewer-coded sex/gender category (female or male) and self-identified gender category (woman or man) (n = 319), (3) those who categorized themselves as a woman but report higher scores in masculinity than femininity (n = 581), (4) those who categorized themselves as a man but report higher scores in femininity than masculinity (n = 306), and (5) those with equal values on femininity and masculinity (n = 1,826, of which 1,089 were male and 737 were female). Overall, the non-conforming category comprised a heterogeneous group of trans and non-binary individuals, and more masculine women and feminine men. This was done to capture the mental health risks of individuals whose identity or self-perception does not conform to gender norms, and to have enough participants in each region. After creating the non-conforming category, the median of the continuous self-perceived gender conformity score for each region was used to distinguish more conforming men from less conforming men and more conforming women from less conforming women. This was done to consider the region-specific gender conformity levels.
The regional gender equality indicator
To get a more detailed understanding of how gender regimes and structures moderate the relationship between gender conformity and depressive symptoms, we compiled a macro-level gender equality indicator, which we used as a level-2 variable on the subnational regional level. For this, we used the statistical or state-defined geographical areas that can set their regional policies46. In the EU context, these are called NUTS regions, which can vary on three levels. We used the second NUTS level. However, for Italy, the UK and Germany, the second level was not available in the dataset, and thus for those countries we included information on the first NUTS level. The first NUTS level is a major socioeconomic region within a country46. Our sample comprises 194 regions, with an average of 207 participants (s.d. = 187) per region.
For the regional gender equality index, we combined (1) the percentage of women in politics, (2) attitudes toward gender equality, (3) female employment rates, and (4) attitudes toward homosexuality. The index hence captures both the structural representation of women in the public sphere and cultural attitudes toward gender equality and sexual diversity. The dimensions are also shown in Supplementary Fig. 2a–d. Compared with other gender equality indicators, our regional-level indicator captures the subnational regional level and uses information from both institutional structures and from cultural domains.
Women’s political representation was calculated by taking the average of women’s share in the regional, municipal and national parliaments in 2020, obtained from the female achievement index27. For Norway, Switzerland and the UK, we used the percentage of women in national parliaments for the regions, as no regional-level information was available.
Information for the gender equality attitudes dimension was obtained from the ESS 11th round. We used responses to four items asking respondents whether equal participation of men and women in (1) paid work, (2) political leadership, (3) higher management positions, and (4) equal pay for the same work was generally very good or very bad (7-point scale) in their country (α = 0.79), and aggregated these into a mean for each NUTS region.
The female employment rate was obtained from the 2023 Eurostat for each NUTS region29. The attitudes toward homosexuality dimension was based on 3 items obtained from the ESS 11th round. These items asked to what extent respondents disagreed or agreed with the following: (1) gay men and lesbians should be free to live their own life as they wish, (2) gay male and lesbian couples should have the same rights to adopt children as straight couple and (3) if a close family member was a gay man or a lesbian, I would feel ashamed. The items were recoded so that higher values indicate more liberal attitudes, ranging from 1 for disagree strongly to 5 for strongly agree (α = 0.78). We calculated the mean of the three items and aggregated them for each of the NUTS regions.
The four dimensions were then used to construct an overall index of regional gender equality. For the index (shown in Fig. 1), each dimension is normalized between zero and one, with the latter denoting the maximum possible level of gender equality. Then, for each NUTS region, the mean across the four indicators is taken to calculate the specific gender equality level. The correlations between the dimensions women’s share in politics, the gender equality attitudes and attitudes toward homosexuality are moderate to strong (0.63 < r < 0.71), whereas the correlations with female employment rate are weaker (r < 0.5).
Control variables
At an individual level, we controlled for sociodemographic background characteristics, including partnership status, whether the respondent lived with children under 18 years old, age, total years of education and migration background (meaning not being a citizen of the country or not being born in the country). In addition, we controlled for the respondent’s experience of their current income (living comfortably, coping, difficult or very difficult). To control for physical health challenges, we summed the reported health challenges that hampered life, for example, challenges related to cardiovascular health, musculoskeletal health and the digestive system. This ranged from 0 for no health challenges to 11 for all listed health challenges. Lastly, we controlled for hours spent doing care work, divided into 4 categories: no care work, less than 11 hours, 11–30 hours and 31 hours or more in a week.
At the macro level, as measures of economic prosperity and security, we controlled for regional gross domestic product (GDP) per capita in 202347 and the regional unemployment rate in 202348. This is supposed to ensure that our results reflect the influence of gender norms and institutions and opportunities for gender expression, rather than general economic conditions.
Statistics
No statistical method was used to predetermine sample size. No data were excluded from the analyses. The studied variables had less than 2% missing data due to item non-response, which was handled using single imputation. For binary variables, imputation was done using logistic regressions; for categorical variables, polynomial regressions; and for continuous variables, predicted mean matching49.
To investigate how self-perceived gender conformity relates to depressive symptoms, we ran two-level multilevel models with an individual level and a macro level, where the regional NUTS level was the highest level. We started with an empty model with CES-D 8 as the outcome, where the intraclass correlation (ICC) was 0.037, calculated as the between-group variance divided by the total variance. The total variance is the variance between groups plus variance within groups. This was used to calculate the design effect, calculated as 1 + (average n per region − 1) × ICC, which was 8.62. Hence, multilevel models are appropriate to account for the clustered structure of our data50.
To test our hypothesis, we started with the continuous self-perceived conformity to gender norms as the main independent variable in the multilevel regression model. Then, we interacted the continuous self-perceived conformity to gender norms with the regional gender equality level (two-way interaction). The models allow for random intercepts and random slopes for the self-perceived gender conformity variable. The model fit was always tested to see whether a more complex model yielded a better model fit. The models were constructed in a stepwise manner, as described in ref. 51. Second, using the same stepwise procedure, we ran a multilevel model with categorical self-perceived gender conformity as the main independent variable. Here, more conforming women are the reference category. We again interacted the main independent variable with the regional gender equality indicator (two-way interaction). The ICC for the continuous model is 0.036 and for the categorical model 0.054. The analysis was performed using R (v.4.4.3). We consider a P value of 0.05 or lower to be the threshold of significance.
Sensitivity analysis
Several sensitivity analyses were performed for this study. First, we checked how the continuous self-perceived gender conformity score correlates with our continuous and categorical ordinal control variables. This was done in a pairwise manner using Pearson correlations (Table 1). Furthermore, we checked how the self-perceived gender conformity categories differ regarding sociodemographic characteristics. This was done using simple regression models for each variable separately, while considering the cluster structure of the data. The results are described at the beginning of the ‘Results’, and the full details can be found in Supplementary Table 2.
Then, to examine how the domains influence the outcome individually, we tested the interaction models presented in Tables 2 and 3 separately with each regional mean-centered gender equality index domain: (1) percentage of women in politics, (2) attitudes toward gender equality, (3) the female employment rates, and (4) attitudes toward homosexuality. The interaction effects were statistically significant in the same or very similar way as for the overall gender equality index for all except for the female employment rate. While widespread labor market participation of women is an essential precondition for economic independence, in the past, female employment was also strongly promoted by non-democratic regimes in Eastern Europe and is, on its own, less likely to represent deep democracy and feminist institutions than political representation and gender equality attitudes. Some interactions involving specific conformity categories toward homosexuality were only close to statistical significance (Supplementary Table 4). In addition, we tested two-way interaction models (similar to the ones presented in Tables 2 and 3), interacting the regional GDP separately with the continuous and categorical self-perceived gender conformity variable, respectively. For this, we mean-centered and standardized GDP. This showed smaller but significant coefficients for the continuous interaction and non-significant results for the categorical variable. Thus, the moderating relationship of context is stronger for regional gender equality than for GDP, suggesting that it is not driven only by variations in regional economic development or prosperity.
Specifically, with the continuous self-perceived gender conformity score models, we also ran a three-way interaction with self-perceived gender conformity × gender equality index × interviewer-coded sex/gender category (female or male). The results are described in the ‘Results’, with the full details presented in Supplementary Table 2.
Lastly, we also tested the models with the self-perceived gender conformity categories presented in Table 3, with the country (n = 24) as the highest level due to a small number of individuals in the non-conforming category in some NUTS regions. This yielded very similar results to the region-level models. We also re-ran the categorical regression models with control over life (ranging from 0 for no control to 10 for complete control) as the dependent variable. Limited control over life may capture one possible mechanism by which restrictive gender norms may trigger more frequent depressive symptoms, especially for non-conforming or less conforming individuals. The observed patterns closely mirror those of the main models presented for depressive symptoms. Lastly, we also ran the categorical models without assigning transgender participants to the non-conforming category. This was done because some transgender individuals may not identify as non-conforming, but rather as strongly conforming to their transitioned gender category. The results remained largely the same and are presented in Supplementary Table 5.
Reporting summary
Further information on research design is available in the Nature Portfolio Reporting Summary linked to this article.
Data availability
Data are freely available from the ESS Data Portal via https://ess.sikt.no/en/.
Code availability
The R code used for the data analysis and visualization is available via Code Ocean at https://doi.org/10.24433/CO.4314134.v1 (ref. 52).
References
-
Santos, J. V. et al. The state of health in the European Union (EU-27) in 2019: a systematic analysis for the Global Burden of Disease study 2019. BMC Public Health 24, 1374 (2024).
-
GBD 2019 Mental Disorders Collaborators Global, regional, and national burden of 12 mental disorders in 204 countries and territories, 1990–2019: a systematic analysis for the Global Burden of Disease Study 2019. Lancet Psychiatry 9, 137–150 (2022).
-
Li, S. et al. Sex difference in incidence of major depressive disorder: an analysis from the Global Burden of Disease Study 2019. Ann. Gen. Psychiatry 22, 53 (2023).
-
Lin, J. et al. Does gender role explain a high risk of depression? A meta-analytic review of 40 years of evidence. J. Affect. Disord. 294, 261–278 (2021).
-
Von Zimmermann, C. et al. Masculine depression and its problem behaviors: use alcohol and drugs, work hard, and avoid psychiatry!. Eur. Arch. Psychiatry Clin. Neurosci. 274, 321–333 (2024).
-
Call, J. B. & Shafer, K. Gendered manifestations of depression and help seeking among men. Am. J. Mens Health 12, 41–51 (2018).
-
O’Neil, J. M. Summarizing 25 years of research on men’s gender role conflict using the Gender Role Conflict Scale: new research paradigms and clinical implications. Couns. Psychol. 36, 358–445 (2008).
-
Kirkbride, J. B. et al. The social determinants of mental health and disorder: evidence, prevention and recommendations. World Psychiatry 23, 58–90 (2024).
-
Xu, Y., Feng, J. & Rahman, Q. Gender nonconformity and common mental health problems: a meta-analysis. Clin. Psychol. Rev. 114, 102500 (2024).
-
Subramaniapillai, S., Galea, L. A. M., Einstein, G. & De Lange, A.-M. G. Sex and gender in health research: intersectionality matters. Front. Neuroendocrinol. 72, 101104 (2024).
-
Risman, B. J. Gender as a social structure: theory wrestling with activism. Gend. Soc. 18, 429–450 (2004).
-
Perry, D. G., Pauletti, R. E. & Cooper, P. J. Gender identity in childhood: a review of the literature. Int. J. Behav. Dev. 43, 289–304 (2019).
-
Mauvais-Jarvis, F. et al. Sex and gender: modifiers of health, disease, and medicine. Lancet 396, 565–582 (2020).
-
Brewis, A. et al. in Sex and Gender (eds DuBois, L. Z. et al.) 241–265 (Springer Nature, 2025); https://doi.org/10.1007/978-3-031-91371-6_12
-
Ritz, S. A. et al. in Sex and Gender (eds DuBois, L. Z. et al.) 87–112 (Springer Nature, 2025); https://doi.org/10.1007/978-3-031-91371-6_5
-
Lefevor, G. T., Boyd-Rogers, C. C., Sprague, B. M. & Janis, R. A. Health disparities between genderqueer, transgender, and cisgender individuals: an extension of minority stress theory. J. Couns. Psychol. 66, 385–395 (2019).
-
Mahfouda, S. et al. Gender non-conformity in childhood and adolescence and mental health through to adulthood: a longitudinal cohort study, 1995–2018. Psychol. Med. 53, 7756–7765 (2023).
-
Magliozzi, D., Saperstein, A. & Westbrook, L. Scaling up: representing gender diversity in survey research. Socius Sociol. Res. Dyn. World 2, 237802311666435 (2016).
-
Connell, R. Gender, health and theory: conceptualizing the issue, in local and world perspective. Soc. Sci. Med. 74, 1675–1683 (2012).
-
Schippers, M. Recovering the feminine other: masculinity, femininity, and gender hegemony. Theory Soc. 36, 85–102 (2007).
-
Bem, S. L. On the utility of alternative procedures for assessing psychological androgyny. J. Consult. Clin. Psychol. 45, 196–205 (1977).
-
Kachel, S., Steffens, M. C. & Niedlich, C. Traditional masculinity and femininity: validation of a new scale assessing gender roles. Front. Psychol. 7, 956 (2016).
-
Alexander, A. C., Bolzendahl, C. & Öhberg, P. Gender, socio-political cleavages and the co-constitution of gender identities: a multidimensional analysis of self-assessed masculine and feminine characteristics. Eur. J. Polit. Gend. 4, 151–171 (2021).
-
Hart, C. G., Saperstein, A., Magliozzi, D. & Westbrook, L. Gender and health: beyond binary categorical measurement. J. Health Soc. Behav. 60, 101–118 (2019).
-
Zentner, M. & Von Aufsess, C. Is being gender nonconforming distressing? It depends where you live: gender equality across 15 nations predicts how much gender nonconformity is related to self-esteem. Psychol. Med. 52, 1857–1865 (2022).
-
Hertner, I. Gendering European politics: A story of progress and backlash. J. Eur. Integr. 43, 511–517 (2021).
-
Norlén, H., Papadimitriou, E., De Dominicisi, L. & Dijkstra, L. Mapping the Glass Ceiling: the EU Regions Where Women Thrive and Where They Are Held Back: Monitoring EU Regional Gender Equality with the Female Achievement and Disadvantage Indices (Publications Office of the European Union, Luxembourg, 2021); https://doi.org/10.2776/07411
-
Lomazzi, V., Israel, S. & Crespi, I. Gender equality in Europe and the effect of work–family balance policies on gender-role attitudes. Soc. Sci. 8, 5 (2018).
-
Eurostat. Employment rates by NUTS 2 region. Eurostat https://doi.org/10.2908/LFST_R_LFE2EMPRT (2025).
-
Walby, S. Authoritarianism, violence, and varieties of gender regimes: violence as an institutional domain. Womens Stud. Int. Forum 98, 102677 (2023).
-
Slootmaeckers, K. Constructing European Union identity through LGBT equality promotion: crises and shifting othering processes in the European Union enlargement. Polit. Stud. Rev. 18, 346–361 (2020).
-
Kaiser, C., Muggleton, N., Quispe-Torreblanca, E. & De Neve, J.-E. Two paradoxes in women’s well-being. Sci. Adv. 11, eadt1646 (2025).
-
Van De Velde, S., Bracke, P., Levecque, K. & Meuleman, B. Gender differences in depression in 25 European countries after eliminating measurement bias in the CES-D 8. Soc. Sci. Res. 39, 396–404 (2010).
-
Jewkes, R. et al. Hegemonic masculinity: combining theory and practice in gender interventions. Cult. Health Sex. 17, 112–127 (2015).
-
Andermann, L. Culture and the social construction of gender: mapping the intersection with mental health. Int. Rev. Psychiatry 22, 501–512 (2010).
-
Awaworyi Churchill, S., Munyanyi, M. E., Prakash, K. & Smyth, R. Locus of control and the gender gap in mental health. J. Econ. Behav. Organ. 178, 740–758 (2020).
-
Richards, C. et al. Non-binary or genderqueer genders. Int. Rev. Psychiatry 28, 95–102 (2016).
-
Stommel, M. et al. Gender bias in the measurement properties of the center for epidemiologic studies depression scale (CES-D). Psychiatry Res. 49, 239–250 (1993).
-
Gidengil, E. & Stolle, D. Comparing self-categorisation approaches to measuring gender identity. Eur. J. Polit. Gend. 4, 31–50 (2021).
-
European Social Survey European Research Infrastructure (ESS ERIC). ESS11 – integrated file, edition 2.0. Sikt – Norwegian Agency for Shared Services in Education and Research. ESS Data Portal https://doi.org/10.21338/ESS11E02_0 (2024).
-
International Statistical Institute. ISI Declaration on Professional Ethics (ISI, 2023); https://isi-web.org/isi-declaration-professional-ethics-0
-
Santor, D. A. & Coyne, J. C. Shortening the CES-D to Improve Its Ability to Detect Cases of Depression. Psychol. Assess. 9, 233–243 (1997).
-
Schober, P. S., Philipp, M.-F. & Büchau, S. Gradational gender identification across European gender regimes. Preprint at OSF https://doi.org/10.31235/osf.io/k8qnw_v1 (2025).
-
Solevid, M., Wängnerud, L., Djerf-Pierre, M. & Markstedt, E. Gender gaps in political attitudes revisited: the conditional influence of non-binary gender on left–right ideology and GAL-TAN opinions. Eur. J. Polit. Gend. 4, 93–112 (2021).
-
De Vries, L., Fischer, M. & Kasprowski, D. ‘männlich’, ‘weiblich’, ‘divers’ – Eine kritische auseinandersetzung mit der erhebung von geschlecht in der quantitativ-empirischen Sozialforschung. Z. Für Soziol. 53, 364–386 (2024).
-
Eurostat. NUTS—Nomenclature of territorial units for statistics. Eurostat https://ec.europa.eu/eurostat/web/nuts (2024).
-
Eurostat. Gross domestic product (GDP) at current market prices by NUTS 2 region. Eurostat https://doi.org/10.2908/NAMA_10R_2GDP (2025).
-
Eurostat. Unemployment rates by educational attainment level and NUTS 2 region. Eurostat https://doi.org/10.2908/LFST_R_LFU3RT (2025).
-
van Buuren, S. Flexible Imputation of Missing Data (CRC Press, 2018).
-
Sommet, N. & Morselli, D. Keep calm and learn multilevel linear modeling: a three-step procedure using SPSS, Stata, R, and Mplus. Int. Rev. Soc. Psychol. 34, 24 (2021).
-
Shaw, M. & Flake, J. K. 6: Random effects and cross-level interactions. in Introduction to Multilevel Modelling (accessed 25 May 2026); https://www.learn-mlms.com/06-module-6.html#data-demonstration-4
-
Wierenga, H., Derntl, B. & Schober, P. Self-perceived gender conformity and depressive symptoms across European gender regimes [Source Code]. Code Ocean https://doi.org/10.24433/CO.4314134.v1 (2026).
Acknowledgements
We thank the colleagues from the International Research Training Group (IRTG) 2804 for their support and feedback throughout the process of developing this article. We are grateful for our colleagues in the microsociology team at Tübingen University for their guidance and recommendations. This research was supported by a grant from the German Research Foundation (DFG) (IRTG 2804, awarded to B.D. and P.S., which funded the PhD position of H.W.). The funders had no role in study design, data collection and analysis, decision to publish or preparation of the paper.
Funding
Open access funding provided by Eberhard Karls Universität Tübingen.
Ethics declarations
Competing interests
The authors declare no competing interests.
Peer review
Peer review information
Nature Mental Health thanks Manuela Barreto, David M. Doyle and the other, anonymous, reviewer(s) for their contribution to the peer review of this work. Peer reviewer reports are available.
Additional information
Publisher’s note Springer Nature remains neutral with regard to jurisdictional claims in published maps and institutional affiliations.
Supplementary information
Rights and permissions
Open Access This article is licensed under a Creative Commons Attribution 4.0 International License, which permits use, sharing, adaptation, distribution and reproduction in any medium or format, as long as you give appropriate credit to the original author(s) and the source, provide a link to the Creative Commons licence, and indicate if changes were made. The images or other third party material in this article are included in the article’s Creative Commons licence, unless indicated otherwise in a credit line to the material. If material is not included in the article’s Creative Commons licence and your intended use is not permitted by statutory regulation or exceeds the permitted use, you will need to obtain permission directly from the copyright holder. To view a copy of this licence, visit http://creativecommons.org/licenses/by/4.0/.
About this article

Cite this article
Wierenga, H., Derntl, B. & Schober, P. Self-perceived gender conformity relates to depressive symptoms across Europe. Nat. Mental Health (2026). https://doi.org/10.1038/s44220-026-00670-0
-
Received:
-
Accepted:
-
Published:
-
Version of record:
-
DOI: https://doi.org/10.1038/s44220-026-00670-0
Leave a Reply